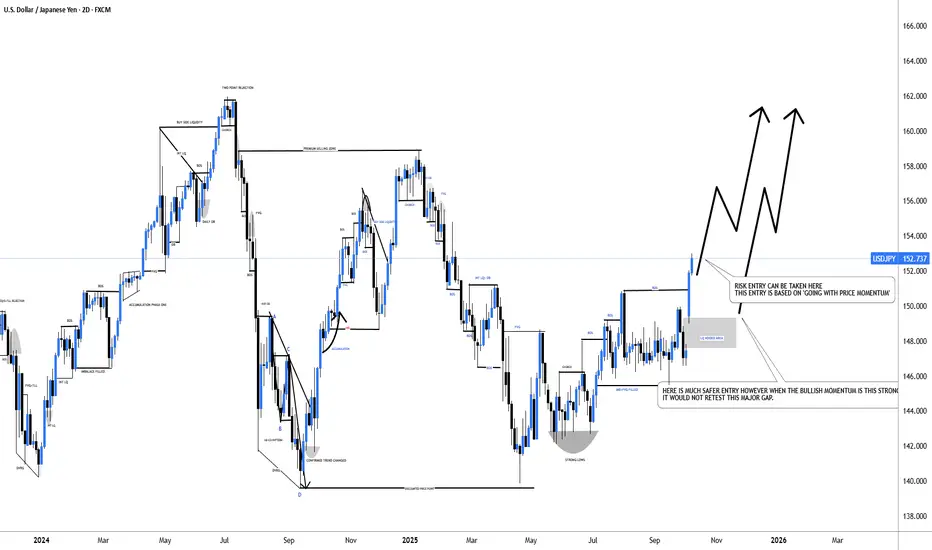
#USDJPY: From +1100 Pips To +1350 Pips A Possible Swing BuyDear Traders,
I hope you’re all having a great trading week!
The USDJPY is currently trading in a 152 price range and is experiencing extreme bullish momentum. The price is rallying without making any corrections, primarily due to the collapse of the Yen. We may see it fall further below. Given th

The best trades require research, then commitment.
Get started for free$0 forever, no credit card needed

Scott "Kidd" PoteetThe unlikely astronaut

Where the world does markets
Join 100 million traders and investors taking the future into their own hands.
Major indices
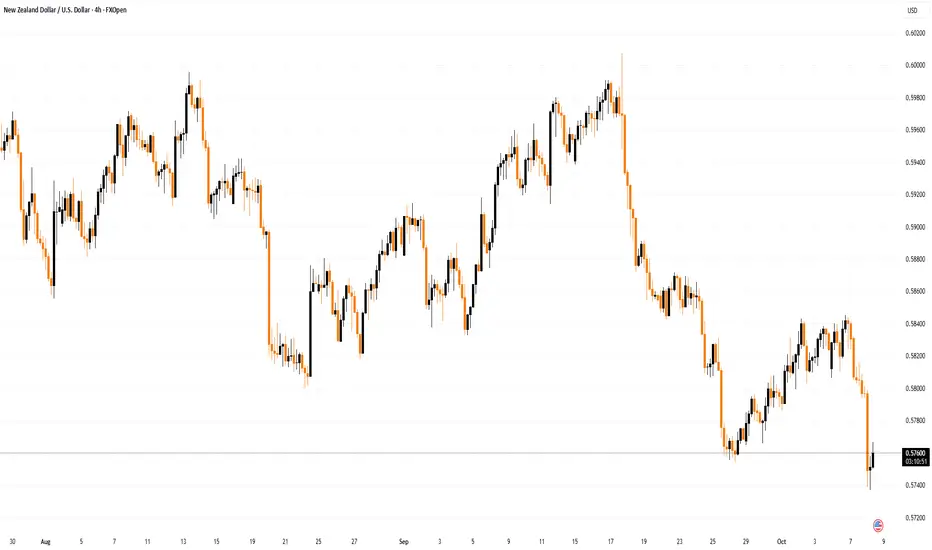
NZD/USD Rate Drops Sharply After Central Bank DecisionNZD/USD Rate Drops Sharply After Central Bank Decision
This morning, the Reserve Bank of New Zealand (RBNZ) cut its key interest rate. According to Forex Factory, the Official Cash Rate was reduced by 50 basis points from 3.0% to 2.5%, while most analysts had expected a smaller cut to 2.75%.
More
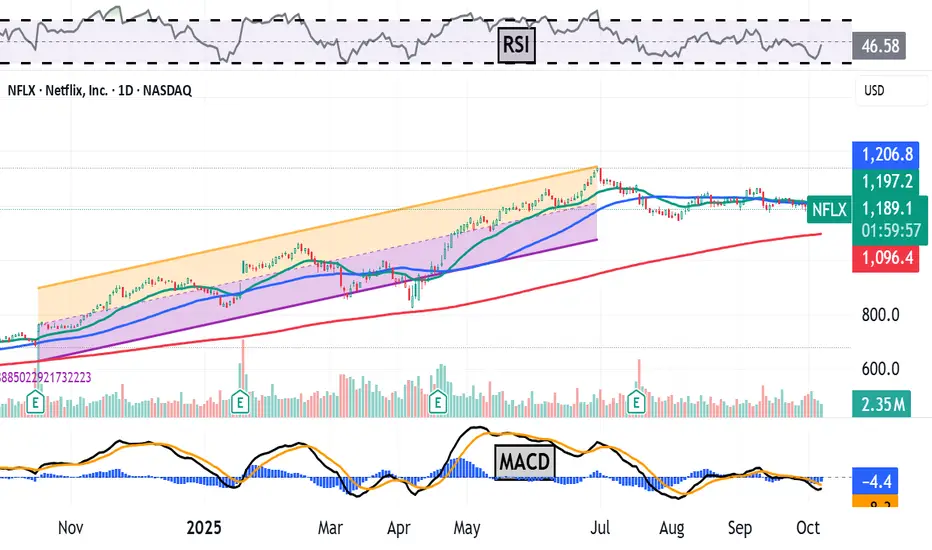
Netflix Is -11% Since June's All-Time High. What Its Chart SaysNetflix NASDAQ:NFLX has fallen more than 10% since hitting an all-time high in June, but the streaming giant is still beating the S&P 500 SP:SPX in the year-to-date, one-year and five-year periods. What does technical and fundamental analysis say is going on?
Let's take a look:
Netflix's Fund
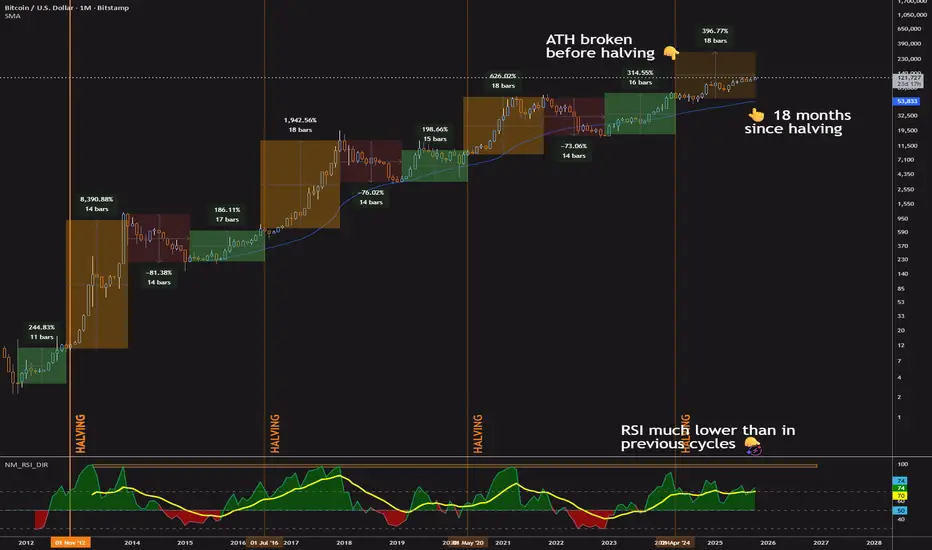
Is Bitcoin's 4-Year Cycle Over? Bitcoin’s 4-year cycle has been a go-to for traders, driven by halving events that spark price surges, sharp corrections, and recovery periods. But something’s off this time.
We’re 18 months into the post-2024 halving rally—hitting the historical peak for bull runs—yet there’s no sign of a crash,
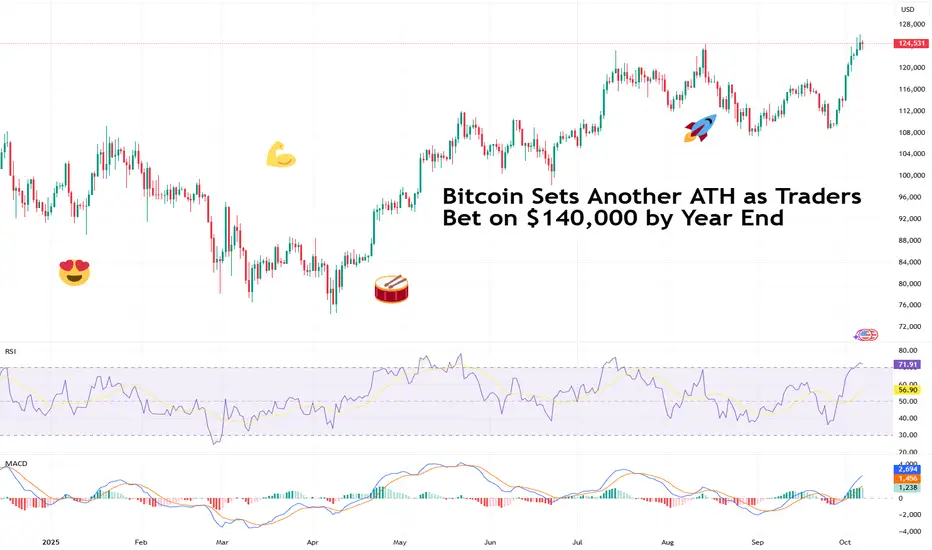
Bitcoin Sets Another ATH as Traders Bet on $140,000 by Year EndBlink and you’ll miss it. Bitcoin’s recent leg up caught lots of traders unprepared. After sinking below $110,000 few weeks back, the OG coin slingshotted to a fresh record high above $126,000 this week. Not a bad way to start October Uptober .
Now, traders are adding to bets that the price will
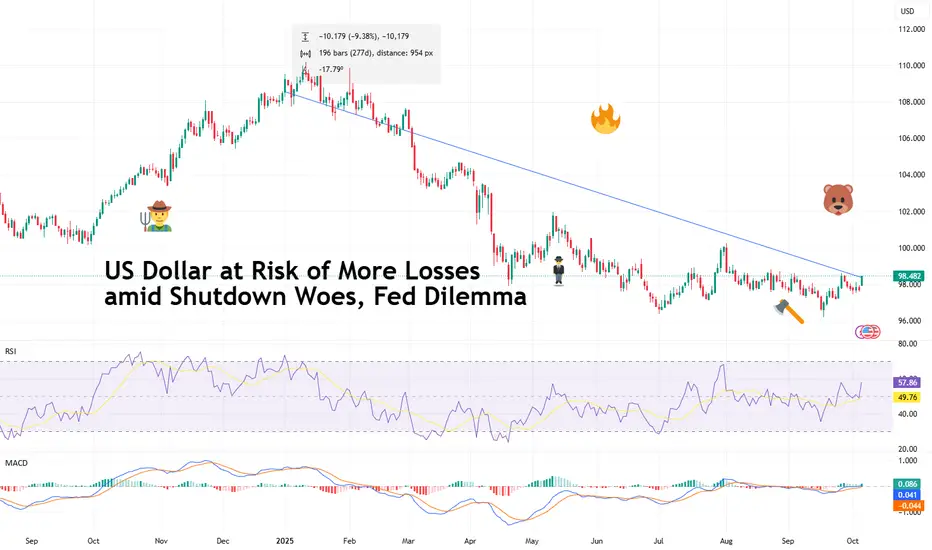
US Dollar at Risk of More Losses amid Shutdown Woes, Fed DilemmaThe US dollar TVC:DXY has been knocked by last week’s US government shutdown and the subsequent economic blackout. At the same time, the Federal Reserve can’t figure out what’s worse – inflation or job crunch.
After Congress failed to pass a funding bill, the government officially went dark at
Retro Editors' picks 2024Closing our retro EP selection , we present to you the last collection of additional scripts that have earned a spot in our Editors' picks, in this case from 2024.
These retrospective selections reflect our continued commitment to honoring outstanding contributions in our community, regardless of

SILVER (XAG/USD): One More Bullish Wave is Coming?!⚠️ SILVER appears to be confined within a horizontal range, as observed on the 4-hour chart. The price is currently nearing the upper limit of this range.
Given the prevailing strong bullish trend, there is a considerable likelihood of a continued upward movement.
A breakout and a 4-hour candle cl

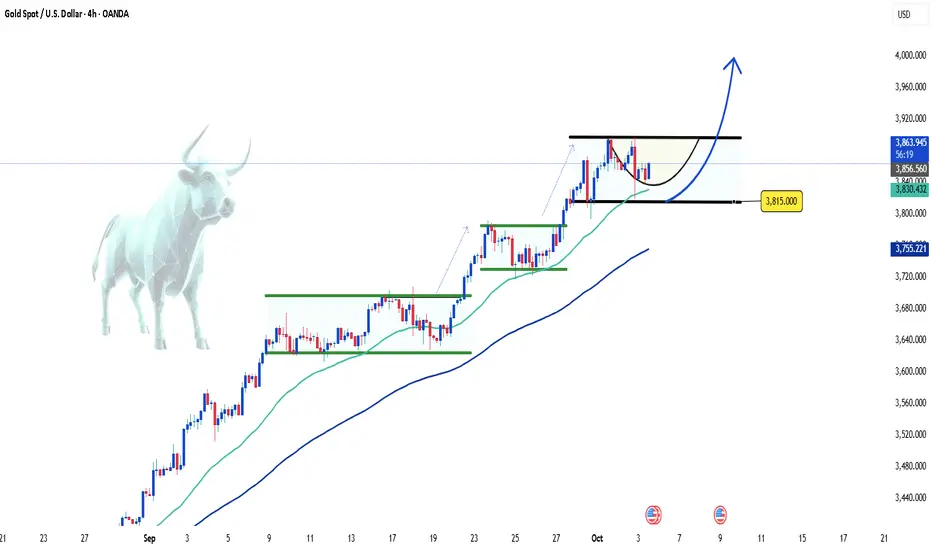
Gold Continues to Challenge Record Resistance Levels👋Hello everyone, what are your thoughts on OANDA:XAUUSD ?
As of this writing, gold continues its upward momentum, having reached new highs as investors increase their bets on the Federal Reserve cutting interest rates in the near future. The concerns over the U.S. government shutdown and global e
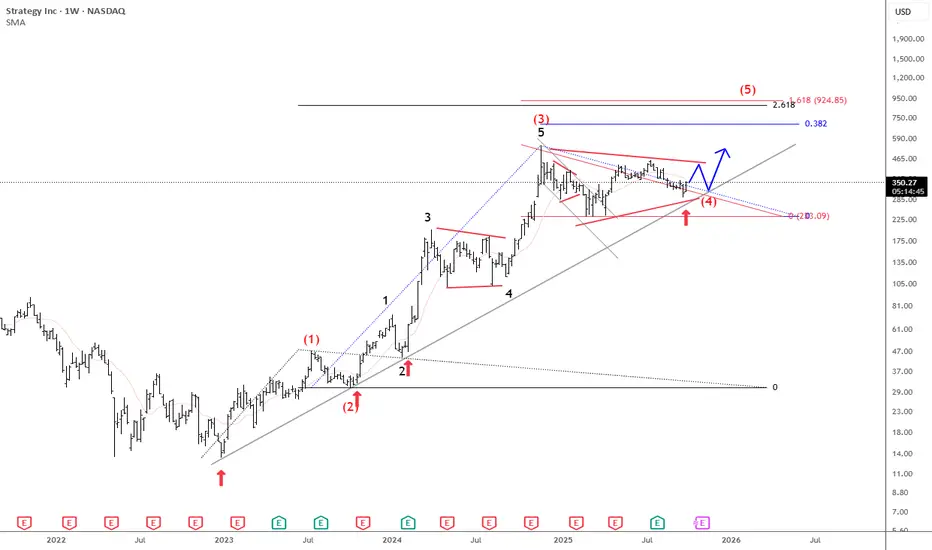
Microstrategy Is Still Pointing Higher For The Final 5th WaveMicrostrategy is a US business intelligence and software company, but it has become best known for its aggressive Bitcoin strategy. Under co-founder Michael Saylor, the company shifted from focusing mainly on software to also using Bitcoin as its primary treasury reserve asset.
Since 2020, MicroStra
See all editors' picks ideas
PongExperience PONG! The classic arcade game, now on your charts!
With this indicator, you can finally achieve your lifelong dream of beating the Markets. . . at PONG!
Pong is jam-packed with features! Such as:
2 Paddles
A moving dot
Floating numbers
The idea of a net
This indicator is solel

Options Max Pain Calculator [BackQuant]Options Max Pain Calculator
A visualization tool that models option expiry dynamics by calculating "max pain" levels, displaying synthetic open interest curves, gamma exposure profiles, and pin-risk zones to help identify where market makers have the least payout exposure.
What is Max Pain?
Max

Volume Profile 3D (Zeiierman)█ Overview
Volume Profile 3D (Zeiierman) is a next-generation volume profile that renders market participation as a 3D-style profile directly on your chart. Instead of flat histograms, you get a depth-aware profile with parallax, gradient transparency, and bull/bear separation, so you can see w

RiskMetrics█ OVERVIEW
This library is a tool for Pine programmers that provides functions for calculating risk-adjusted performance metrics on periodic price returns. The calculations used by this library's functions closely mirror those the Broker Emulator uses to calculate strategy performance metrics (

Simple Decesion Matrix Classification Algorithm [SS]Hello everyone,
It has been a while since I posted an indicator, so thought I would share this project I did for fun.
This indicator is an attempt to develop a pseudo Random Forest classification decision matrix model for Pinescript.
This is not a full, robust Random Forest model by any stretch o

Tick CVD [Kioseff Trading]Hello!
This script "Tick CVD" employs live tick data to calculate CVD and volume delta! No tick chart required.
Features
Live price ticks are recorded
CVD calculated using live ticks
Delta calculated using live ticks
Tick-based HMA, WMA, EMA, or SMA for CVD and price
Key tick levels (S

analytics_tablesLibrary "analytics_tables"
📝 Description
This library provides the implementation of several performance-related statistics and metrics, presented in the form of tables.
The metrics shown in the afforementioned tables where developed during the past years of my in-depth analalysis of various str

Adaptive Trend Classification: Moving Averages [InvestorUnknown]Adaptive Trend Classification: Moving Averages
Overview
The Adaptive Trend Classification (ATC) Moving Averages indicator is a robust and adaptable investing tool designed to provide dynamic signals based on various types of moving averages and their lengths. This indicator incorporates multipl

Statistics • Chi Square • P-value • SignificanceThe Statistics • Chi Square • P-value • Significance publication aims to provide a tool for combining different conditions and checking whether the outcome is significant using the Chi-Square Test and P-value.
🔶 USAGE
The basic principle is to compare two or more groups and check the results

FiniteStateMachine🟩 OVERVIEW
A flexible framework for creating, testing and implementing a Finite State Machine (FSM) in your script. FSMs use rules to control how states change in response to events.
This is the first Finite State Machine library on TradingView and it's quite a different way to think about your

See all indicators and strategies
News didn't load
Looks like that didn't go very well. Let's try again.
Community trends
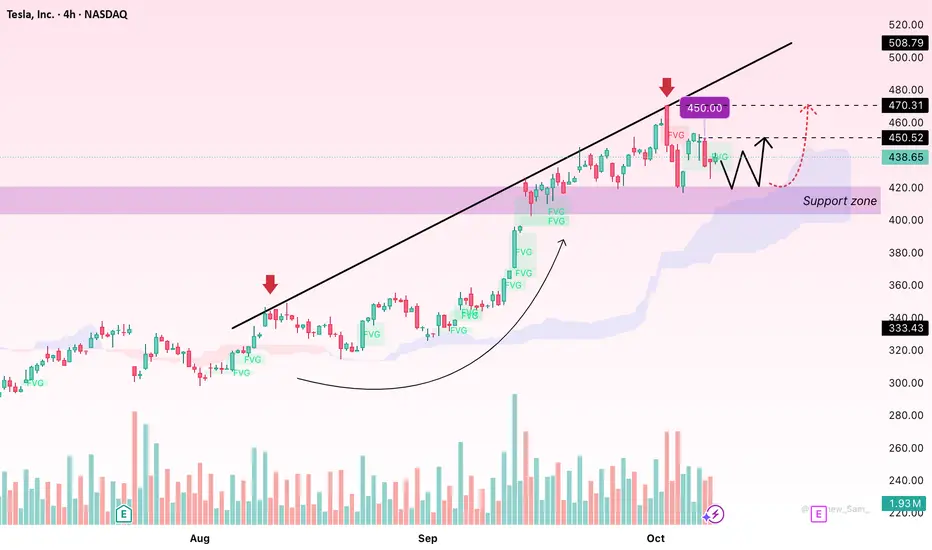
TSLA – Mild Pullback Before Resuming Its Upward TrajectoryHello everyone,
Tesla (TSLA) is showing a healthy technical pullback after an impressive rally, yet the broader bullish trend remains intact. The stock is currently hovering around $438.69, down 4.5% in the latest session — a move that reflects short-term profit-taking rather than a shift in marke
Novo Nordisk – 40-Year Supercycle Breakdown (Monthly)After nearly four decades inside a rising secular channel, Novo Nordisk broke below it for the first time ever in July 2025 . Since then, two consecutive monthly closes below the channel — coupled with two consecutive closes under the monthly EMA 100 (previously flawless support) — confirm a m

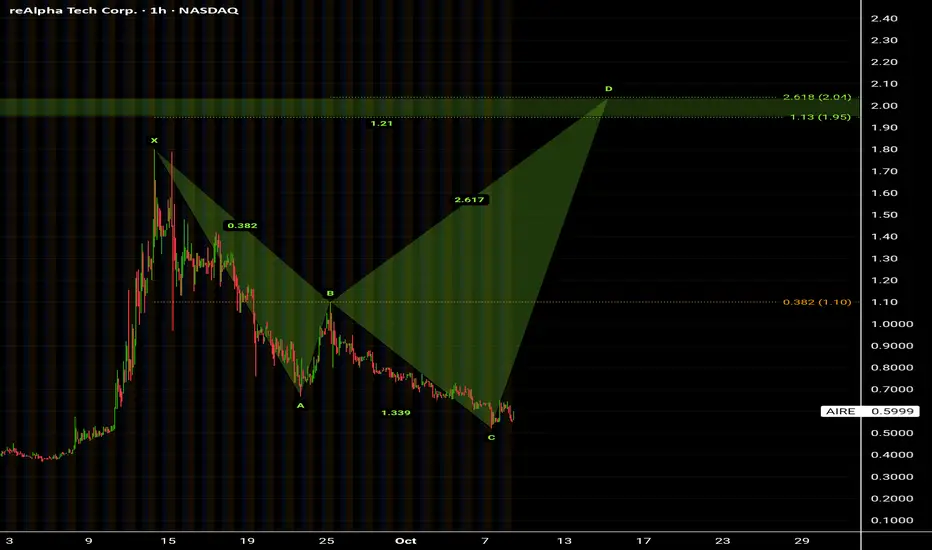
ReAlpha tech corp ( AIRE )Stock on triggering level as I noticed.
Anti Gartley harmonic shap formation pattern on progress.
By breaking up level 1.10 💥 point (B) , the pattern will be activated.
Target prices in the zone between 1.95$ - 2.04$ .
Highly recommended for Buying from present level 👌
I knew it is not expec
SOFI: Buyers in Control? Heading Toward $31?SOFI is showing strength as AVWAP and HVN hold as key support — a clear sign that buyers are in control. 📊
If momentum continues, we could see a push toward the $31 target zone in the coming weeks.
👉 What’s your take — breakout incoming or another retest of support first?
Based on :
- Fundamental

AWS REVENUE CONCERNS EASED! AMZN EARNINGS MULLIGAN! FULL PORT + NEXT 2 WEEKS OF AMAZON DRIVER WAGES INTO CALLS
26 x 285c 12/19, 5x 280c 11/21
Speculation: We melt up to 235 then pop north for ~10% on the earnings beat + rate cut with SPY 700 EOY projections (In line with GOLDMAN SACHS and WELLS FARGO )
6 of the last 8 earnings reports for AMZN

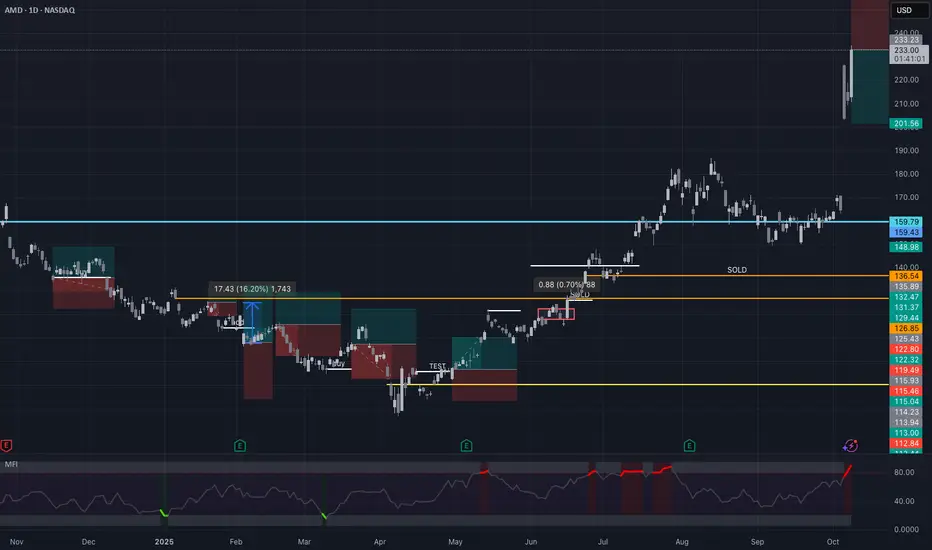
UNBELIEVABLE ! SO ABSURD... AMDThis market has gone completely crazy! Either we go from overselling to overbuying, or we witness a total bubble! When is this circus going to stop?
Soon, half on SPY will have P/E ratio of 100 and everyone will find that normal!
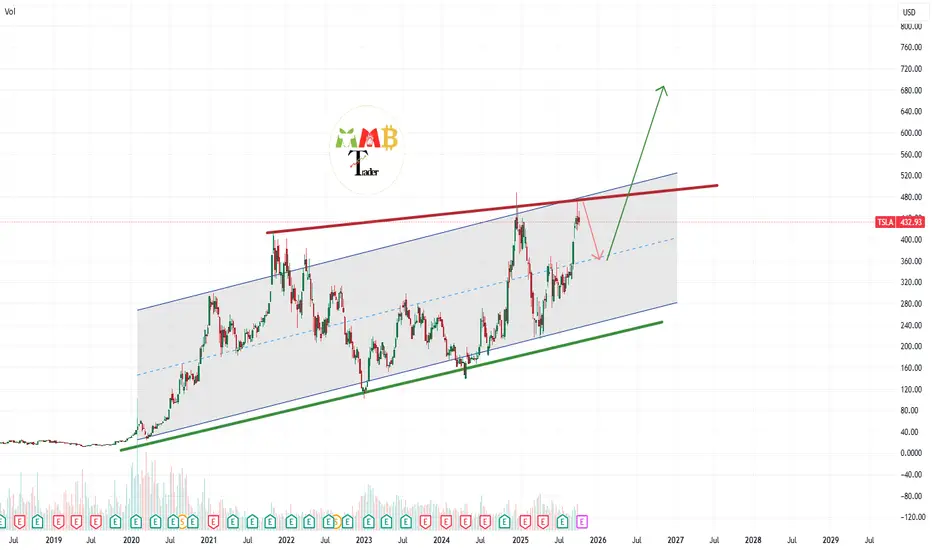
TSLA maybe retest support near 360$ but target is 700$Price is near channel resistance and red trendline sell pressure zone so we can expect short-term fall here like the red arrow but soon after that short-term fall we can expect heavy gain here like the green arrow on chart and targets like 600$ and more also if the red trendline break valid to the u
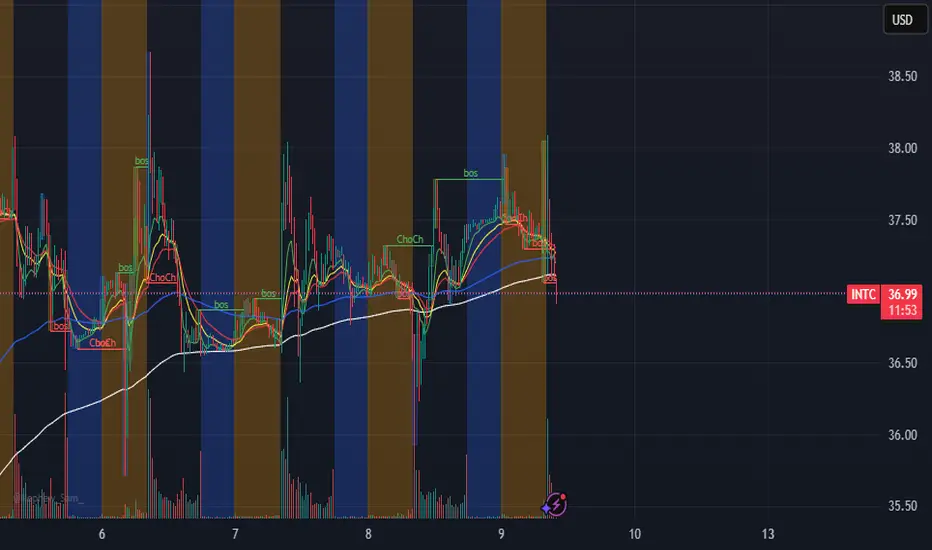
Initiation of Coverage of intel: Rating: BuyReason: over the last several months Intel has aligned itself with multiple competitors as of late. Its latest involvement with AMD, and AMD’s involvement with Open AI will prove a formidable player in the AI realm along with those of the semiconductor business.
Price target $55
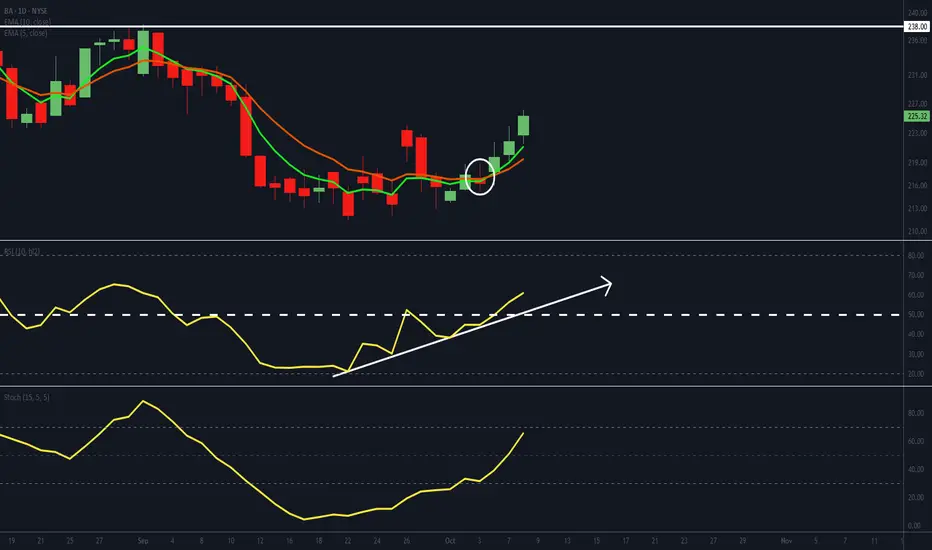
BA setting up for potentially strong move
- BA's EMAs have crossed bullishly and are developing angle and separation.
- Its RSI has popped above 50, suggesting a shift to positive momentum.
- Its stochastic is on the borderline to cross through 70. A move above, will add to the positive momentum argument. The longer it maintains above 70,
My TOP10 picks list in (Silver & Gold) Mining companies 2/10Now that cryptocurrencies are taking a breather and that GOLD is making new ATH after new ATH, it is time to come back to my list of Minining Company Picks.
First Majestic has 2.4 B MarketCap and is a mostly pure silver producing Blue Chip Mining Stock.
First Majestic Silver Corp are a silver focu

See all stocks ideas
Today
PEPPepsiCo, Inc.
Actual
2.29
USD
Estimate
2.26
USD
Today
DALDelta Air Lines, Inc.
Actual
1.71
USD
Estimate
1.53
USD
Today
HELEHelen of Troy Limited
Actual
0.59
USD
Estimate
0.53
USD
Today
NEOGNeogen Corporation
Actual
0.17
USD
Estimate
−0.07
USD
Today
TLRYTilray Brands, Inc.
Actual
0.00
USD
Estimate
−0.03
USD
Today
LFCRLifecore Biomedical, Inc.
Actual
—
Estimate
−0.31
USD
Today
GMGIGolden Matrix Group, Inc.
Actual
—
Estimate
−0.00
USD
Today
CMTLComtech Telecommunications Corp.
Actual
—
Estimate
−0.75
USD
See more events
News didn't load
Looks like that didn't go very well. Let's try again.
Community trends
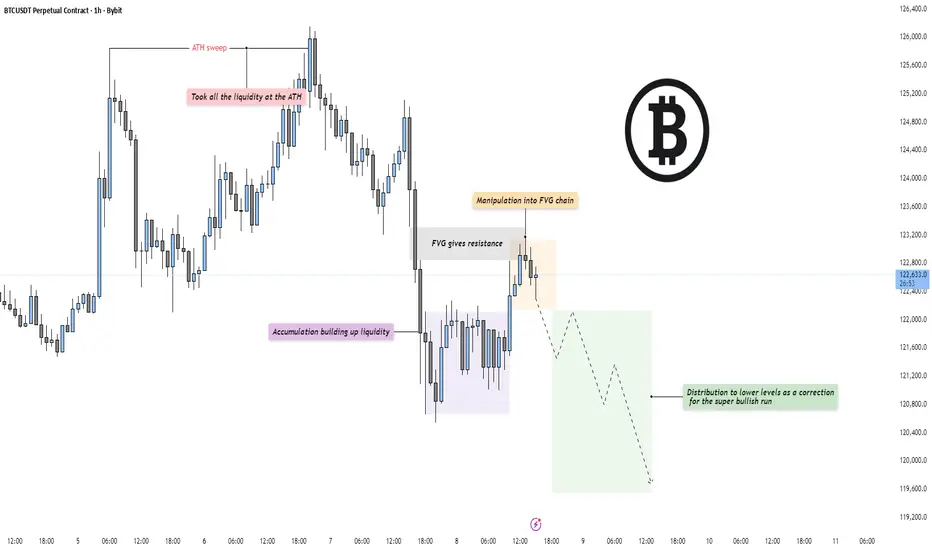
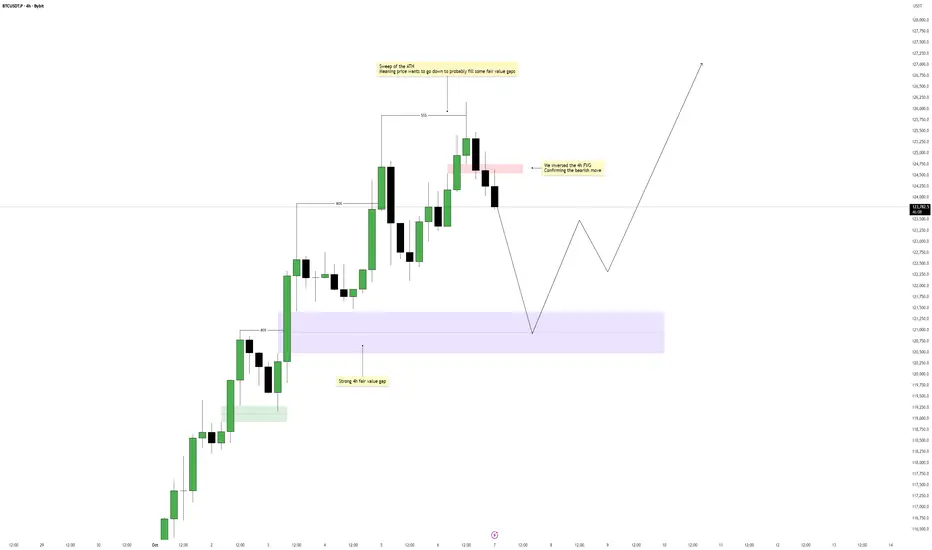
BTC - Distribution after ATH sweepMarket Context
Bitcoin has completed a clear liquidity sweep at the all-time high (ATH) and is now transitioning into a corrective phase. After taking all the liquidity above the prior high, price aggressively rejected and shifted structure to the downside, signaling that smart money may now be eng
Is Bitcoin's 4-Year Cycle Over? Bitcoin’s 4-year cycle has been a go-to for traders, driven by halving events that spark price surges, sharp corrections, and recovery periods. But something’s off this time.
We’re 18 months into the post-2024 halving rally—hitting the historical peak for bull runs—yet there’s no sign of a crash,
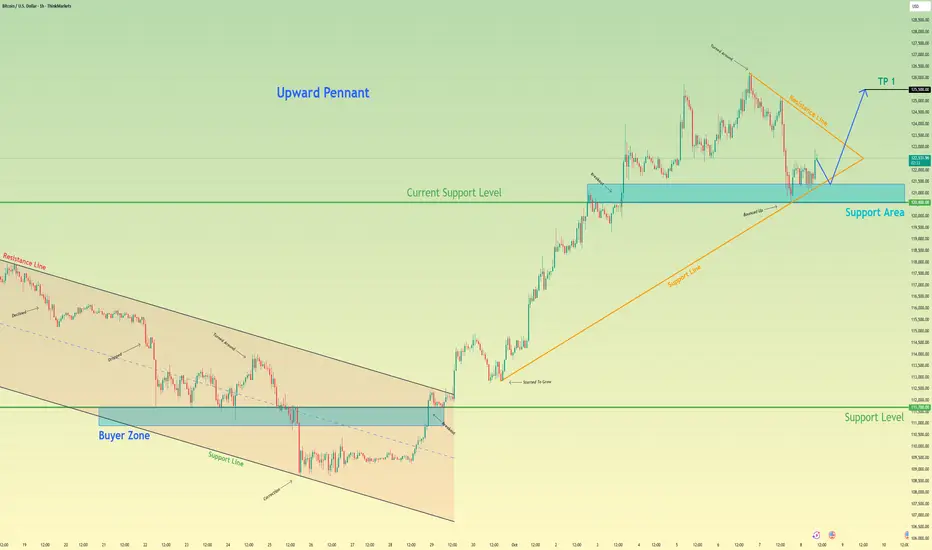
Bitcoin will Bounce From Pennant Support and Rally HigherHello traders, I want share with you my opinion about Bitcoin. The market structure for Bitcoin has recently undergone a major transition from bearish to bullish, following a decisive reversal from the 111700 support level. This shift triggered a breakout from the previous descending channel and gav
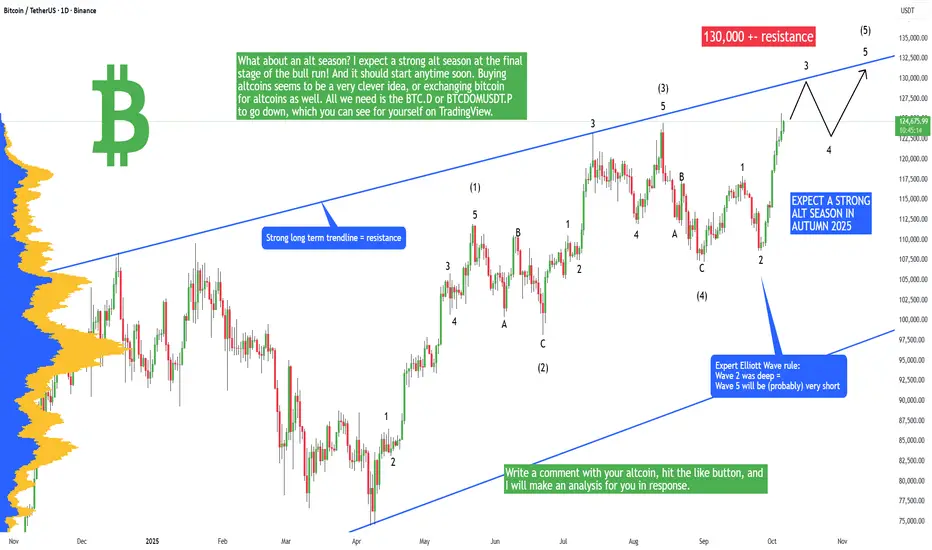
Bitcoin + ALT-SEASON 2025 Starting! (sell here, thank me later)Bitcoin has been pumping heavily in past days! And this trend will likely continue the whole month of October. We have a very likely scenario that will probably happen on Bitcoin, and in this analysis I will tell you which one!
The Elliott Wave theory is one of the strongest tools that you can use
Bitcoin Holds Strong: Bullish Breakout Could Target 127KBitcoin Holds Strong: Bullish Breakout Could Target 127K
Bitcoin recently reached a historic high near 125,760 before correcting about 4%, pulling back to around 120,600.
After this brief correction, the price has started to accumulate again, forming and breaking out from a clear bullish triangle

Bitcoin 119K & 116K will pump it above $130000As we can see price is still bounded with range zone and previous breakout was fake and still 126K$ and 125K$ holding strong but soon from the mentioned support we can expect heavy pump and new ATH above 127K$ or 132K$.
DISCLAIMER: ((trade based on your own decision))
<<press like👍 if you enjoy💚

ETH/USDT: Two shortsHi guys!
Overall Market Structure
The price has been moving within a rising parallel channel, making higher highs and higher lows, which forms a bullish structure.
Recently, however, the price broke below the lower boundary of the ascending channel, signaling a potential bearish reversal or a cor

Bitcoin – Short-Term Weakness, Long-Term StrengthBitcoin has recently swept the all-time high, triggering a short-term reaction from liquidity resting above that level. This move often signals that the market has completed its buy-side run and is now seeking to rebalance inefficiencies created during the aggressive push upward. The current structu
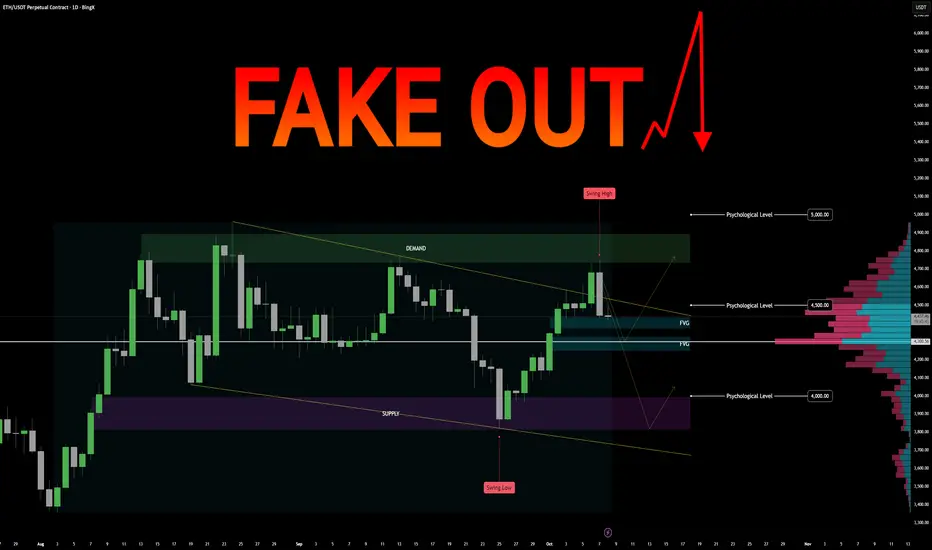
$ETH Market Assessment Incoming FAKEOUT? ETH/USD Perpetual – Market Assessment
Key Zones
Demand: 4737 – 4895
Supply: 3818 – 3994
Fair Value Gaps (FVGs): 4433, 4326
Anchored Volume Node: 4300 (significant liquidity cluster)
Psychological Levels : 4000, 4500, 5000
Recent Swing Points: High 4753, Low 3821
Techni
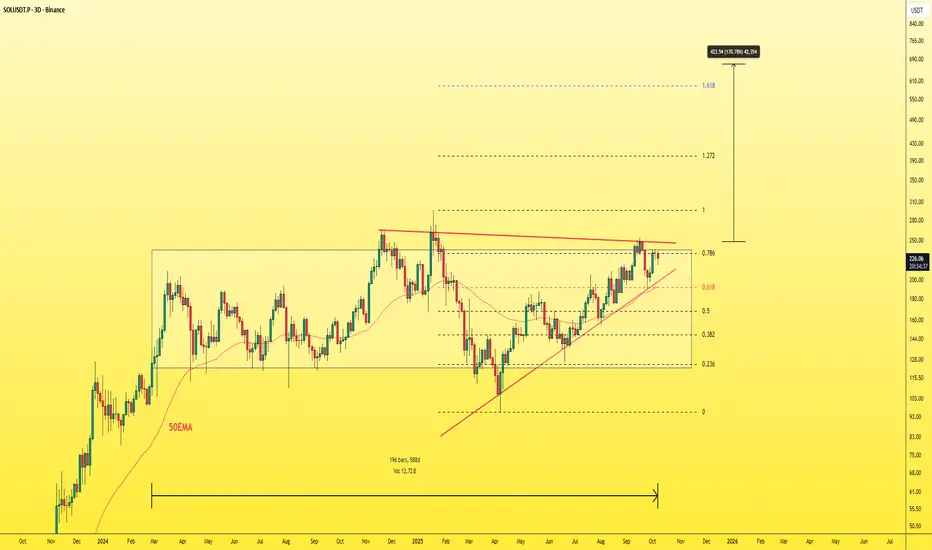
SOLUSDT - Smart Investment!If you missed the Ethereum rally, don’t miss Solana’s.
The 3-day chart looks insanely bullish — the coin has been consolidating for 588 days, almost 20 months.
Right now, it’s forming a massive triangle pattern with a minimum target of $650.
Trust me, you don’t need to put your money into crazy c
See all crypto ideas
News didn't load
Looks like that didn't go very well. Let's try again.
Gold Lacks a Healthy CorrectionGold has been trending steadily within an ascending channel, with buyers keeping control and driving price higher and higher.
And recently price broke above the channel, but it lacked conviction and price is falling back inside the channel.
This might signal buyer exhaustion and a potential shift
Lingrid | GOLD Psychological Barrier Cleared Upside IntactThe price perfectly fulfilled my previous idea . OANDA:XAUUSD continues its climb inside the upward channel, holding above the key 4,000 support after a clean rebound. Price action shows consistent higher lows supported by the upward trendline, signaling sustained bullish momentum. As long as the

GOLD ROUTE MAP UPDATEHey Everyone,
Another PIPTASTIC day on the markets with our chart idea playing out as analysed.
After completing all our bullish targets, we stated yesterday that we now had a confirmed EMA5 cross and lock above 3965 opening 3993.
- This target was hit perfectly followed with a further cross and

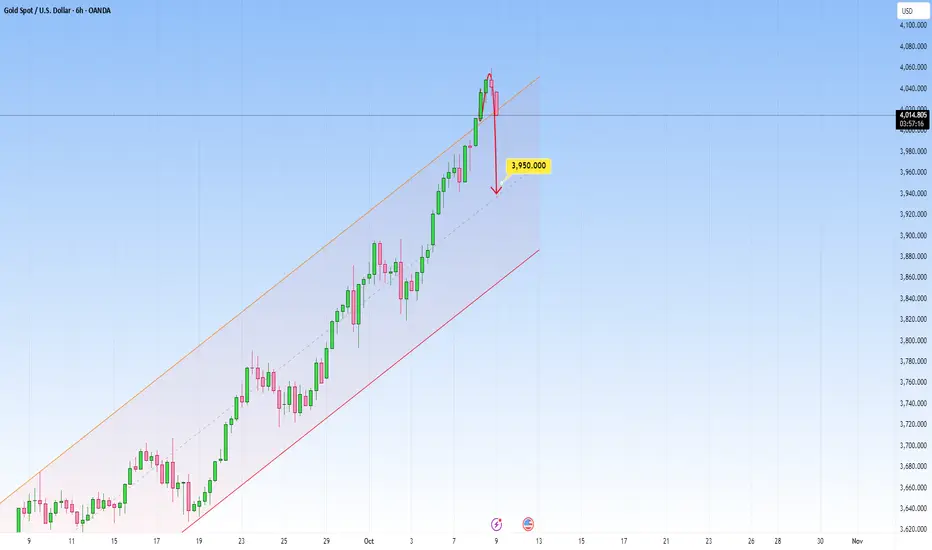
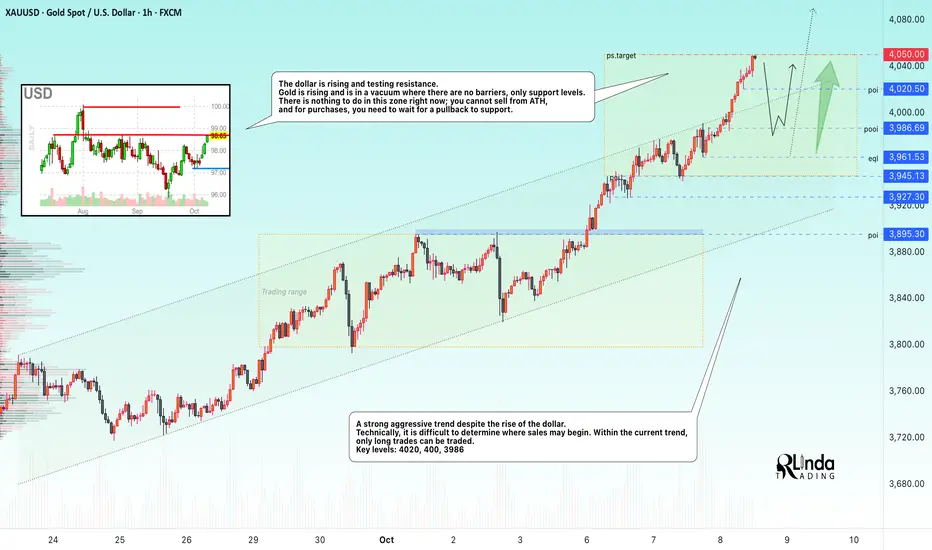
GOLD → Testing 4050 - 4100. Need a pullback to tradeFX:XAUUSD is hitting a new all-time high, testing $4,050, and looks set to reach $4,100. This record growth is linked to falling interest rates and economic risks, which are causing money to flow into hedge assets...
Key drivers: The White House may announce civil service cuts amid the shutdow
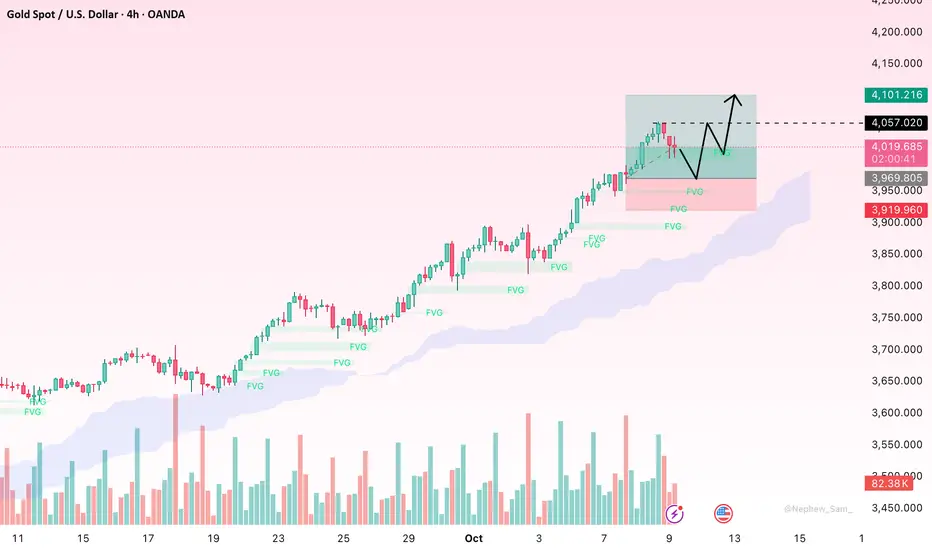
XAU/USD – Uptrend Persists After a Brief CorrectionHello everyone,
Gold is currently taking a natural pause after an impressive October rally. After reaching a peak near $4,036, prices pulled back slightly to around $4,021, yet the overall structure remains firmly bullish. The stepwise Fair Value Gaps (FVG) continue to form and fill shallowly — a
SILVER (XAG/USD): Bullish Rally ContinuesIt appears that 📈SILVER is expected to continue its upward trend, potentially reaching the 50.00 psychological level.
The observed break of structure on the 4-hour chart suggests a strong presence of buyers.
Given the lack of significant US news today, the market is anticipated to maintain a bulli

Latest Gold Price Update Today👋Hello everyone, let's take a look at OANDA:XAUUSD !
Gold has just experienced an incredible surge, briefly reaching 4059 USD, setting a new historic high. This recent upward movement continues to be supported by the ongoing US government shutdown and various geopolitical uncertainties, which hav

Xauusd again Bullish SetupGold (XAU/USD) is trading near the demand zone after a pullback. Price is expected to bounce from support around 4020 toward the target level of 4082. Buy setup active with stop loss below 3995.

Gold Bullish Setup Targeting New ATHThis XAU/USD 1-hour chart shows gold trading around 4039 with a bullish setup. Price is respecting the support trend line, confirming upward momentum. Key support is marked near 4001, providing a strong base for buyers.
The chart highlights the previous ATH at 4060 and projects a potential breakout

XAU/USD | Gold Breaks into $4K Zone – Eyes on $4084 Next!By analyzing the Gold (XAUUSD) chart on the 15-minute timeframe, we can see that the price finally entered the historic $4000 channel today and even surged up to $4050!
It’s now trading around $4042, and if gold manages to stay above $4028, we can expect further bullish movement.
The next upside tar

See all futures ideas
News didn't load
Looks like that didn't go very well. Let's try again.
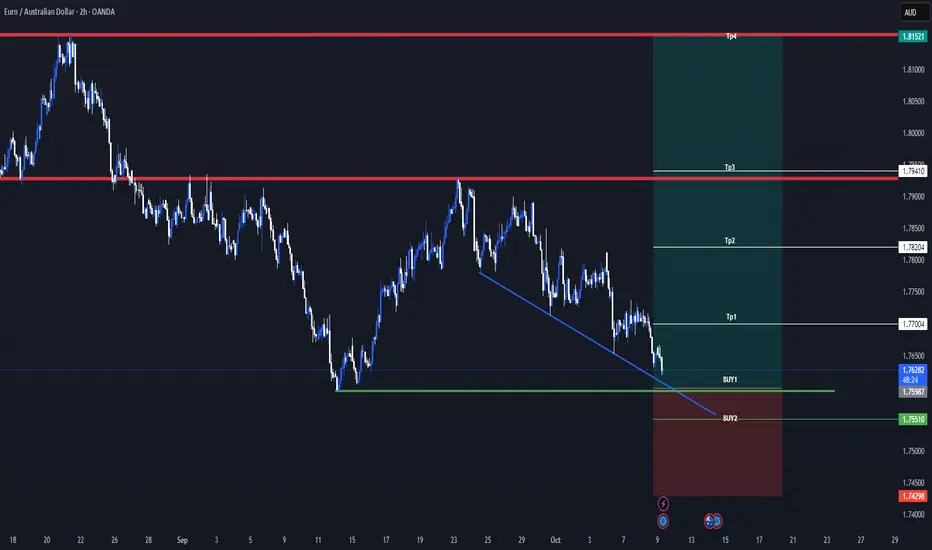
EURAUD Signal : H2 / H4 : Big Long !!!Hello Traders! 👋
What are your thoughts on EURAUD ?
This correction could offer a buy-the-dip opportunity, with potential for a move back toward the recent highs.
EURAUD H2 / H4
Market price : 1.7620
Buy limit : 1.7600 - 1.7550
Tp1 : 1.7700
Tp2 : 1.7820
Tp3 : 1.7940
Tp4 : 1.8150
Sl : 1.7
NZDUSD Eyes 0.5730 Rebound as Dollar Weakens Near DXY ResistanceHey Traders,
In today's trading session, we are monitoring NZDUSD for a buying opportunity around the 0.57300 zone. The pair has been moving within a descending channel and is now approaching the lower boundary, suggesting potential for a technical rebound from channel support.
From a macro perspec

#USDJPY: From +1100 Pips To +1350 Pips A Possible Swing BuyDear Traders,
I hope you’re all having a great trading week!
The USDJPY is currently trading in a 152 price range and is experiencing extreme bullish momentum. The price is rallying without making any corrections, primarily due to the collapse of the Yen. We may see it fall further below. Given th
USDCAD remains bullish, showing signs of strengtheningUSDCAD remains bullish, showing signs of strengthening. After a successful breakout, the pair has completed a minor correction phase, and price accumulation in the current zone suggests potential for further upside movement.
Although the U.S. dollar remains relatively weak in the broader context, t

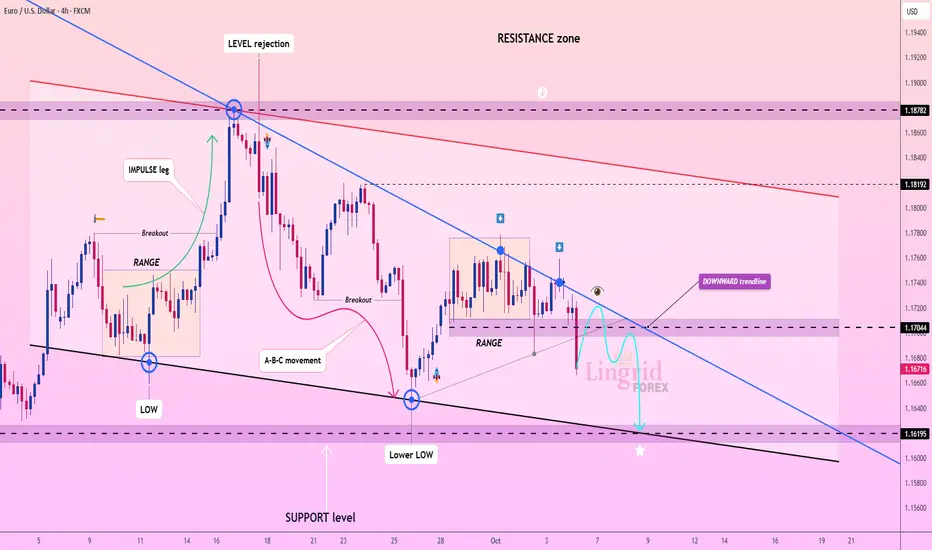
Lingrid | EURUSD Momentum Shift Bearish Movement The price perfectly fulfilled my previous idea . FX:EURUSD is rejecting from the 1.1711 resistance area after testing the downward trendline. Price action shows a descending structure with a sequence of lower highs and lows forming under strong bearish control. A break below 1.1670 could open roo
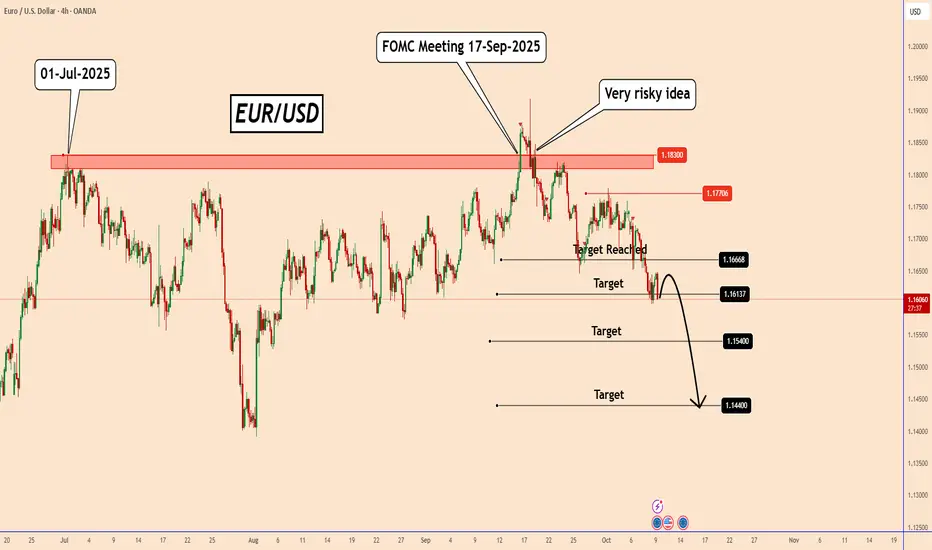
EURUSD: Remains Bearish Despite FOMC MinutesEURUSD: Remains Bearish Despite FOMC Minutes
From our previous analysis, EURUSD achieved two of our targets.
EURUSD remains bearish. Price tested 1.1650 after the FOMC minutes yesterday, but as we can see, the USD is holding up well despite the US Government shutdown.
The fact that the FOMC is c
USDJPY 30Min Engaged ( Bullish Reversal Entry Detected )Time Frame: 30-Minute Warfare
Entry Protocol: Only after volume-verified breakout
🩸Bullish Reversal - 152.500
➗ Hanzo Protocol: Volume-Tiered Entry Authority
➕ Zone Activated: Dynamic market pressure detected.
The level isn’t just price — it’s a memory of where they moved size.
Volume is rising be

EURUSD I Daily CLS range I Manipulation I Sell OffDaily range was manipulated, I se more down ward coming.
Change in order flow confirms my Trading Model 1...
More downside coming...
Big picture view
Be careful its NFP week
David Perk aka Dave Fx Hunter

EURGBP - strong sellers are putting pressure on the market Inability to continue the uptrend. The price faces resistance at 0.8752 and breaks the support of the ascending triangle, which indicates buyer weakness.
A close below 0.8674 will confirm the breakdown of the structure and may increase pressure on the price, which in turn will lead to a decline.

EUR/USD – Technical Analysis for October 9, 2025Market Structure Overview
The Euro continues to follow a clear distribution → drop → consolidation pattern across multiple phases. After each sideways accumulation, price breaks downward with strong momentum, forming a consistent lower-high structure—a textbook example of bearish continuation.
K

See all forex ideas
| - | - | - | - | - | - | - | ||
| - | - | - | - | - | - | - | ||
| - | - | - | - | - | - | - | ||
| - | - | - | - | - | - | - | ||
| - | - | - | - | - | - | - | ||
| - | - | - | - | - | - | - | ||
| - | - | - | - | - | - | - | ||
| - | - | - | - | - | - | - |
News didn't load
Looks like that didn't go very well. Let's try again.
Trade directly on the supercharts through our supported, fully-verified and user-reviewed brokers.


