Soaring platinum breaks a 3 year high at $1,152.50/ozChina, the world’s largest consumer of platinum, imported its highest amount in a year last month. Retail investment demand (bars and coins) in China more than doubled, overtaking North America as the top market for platinum investment.
Analysts at Bloomberg Intelligence predict that global platinum

The best trades require research, then commitment.
Get started for free$0 forever, no credit card needed

Scott "Kidd" PoteetThe unlikely astronaut

Where the world does markets
Join 100 million traders and investors taking the future into their own hands.

Elon Musk vs Trump: Who you betting on?Elon Musk and Donald Trump have recently had a public falling-out, with their feud playing out on social media and in political circles.
The dispute seems to have started over Trump's new budget bill, which Musk has criticized for increasing the national debt. Trump, in turn, accused Musk of being

OptionsMastery: Inverse head and shoulders on UAL! 🔉Sound on!🔉
📣Make sure to watch fullscreen!📣
Thank you as always for watching my videos. I hope that you learned something very educational! Please feel free to like, share, and comment on this post. Remember only risk what you are willing to lose. Trading is very risky but it can change your life!

The MSCI World index sets a new all-time record!The MSCI World stock market index set a new all-time record during the trading session of Monday June 2, wiping out the entire stock market shock of February/March, which saw the global equity market lose 20%. This technical signal still needs to be confirmed at the end of the week at the next weekl

USDJPY forms textbook head and shoulders patternOur last bearish call on USDJPY played out perfectly. Now, a new setup is forming. With US ISM data showing contraction and stock markets under pressure, the dollar-yen could be next to drop. Watch as we break down the textbook head and shoulders pattern and the levels to watch for a potential 600+

Do bulls have enough steam to drive gold higher?A lot of things to consider this week, a lot of data and geopolitical tensions. Will the economic uncertainty and potential bad US jobs data drive TVC:GOLD higher? Let's dig in.
FX_IDC:XAUUSD
Let us know what you think in the comments below.
Thank you.
77.3% of retail investor accounts lose

Bull market scenario LITECOINAt this period, I'm speaking about LITECOIN, which currently has one of the strongest bull-looking charts on cryptocurrency!
We may see the price testing Fibo's higher levels very soon...
A bull market may begin, so I recommend focusing on higher price markings...
On another market, like BTC, Ethe

TRVG - Basic Analysis can lead to great trade ideas!This is as simple as it gets. See a taper, be a taper!
Good trade opportunity incoming if we prove a breakout of red strong selling and we can make our way toward a HTF purple tapered selling and ultimately prove a HTF buying continuation in orange.
Happy Trading :)

Rate Cuts and Risky Bets: When the Fed Rolls Out the Red Carpet🎬 The Fed’s June Meeting Is Around the Corner
Mark your calendars: June 17–18 is when the Federal Reserve's Federal Open Market Committee (FOMC) convenes next. With the benchmark interest rate ECONOMICS:USINTR currently holding steady at 4.25% – 4.50%, investors and policymakers alike are keenl

Bullish Trigger Hit! Looking For Longs on the S&PLast time we spoke, I mentioned some key levels I wanted to see price drop to before considering a move to the upside. And what do you know — here we are.
In today’s video, I share an update on the trade idea and how we can position ourselves for the next big play.
Walk with me as I break down thi

See all editors' picks ideas
TrendMaster Pro 2.3 with Alerts
Hello friends,
A member of the community approached me and asked me how to write an indicator that would achieve a particular set of goals involving comprehensive trend analysis, risk management, and session-based trading controls. Here is one example method of how to create such a system:
Core

Support and Resistance Logistic Regression | Flux Charts💎 GENERAL OVERVIEW
Introducing our new Logistic Regression Support / Resistance indicator! This tool leverages advanced statistical modeling "Logistic Regressions" to identify and project key price levels where the market is likely to find support or resistance. For more information about the proc

Mandelbrot-Fibonacci Cascade Vortex (MFCV)Mandelbrot-Fibonacci Cascade Vortex (MFCV) - Where Chaos Theory Meets Sacred Geometry
A Revolutionary Synthesis of Fractal Mathematics and Golden Ratio Dynamics
What began as an exploration into Benoit Mandelbrot's fractal market hypothesis and the mysterious appearance of Fibonacci sequences i

EMD Trend [InvestorUnknown]EMD Trend is a dynamic trend-following indicator that utilizes Exponential Moving Deviation (EMD) to build adaptive channels around a selected moving average. Designed for traders who value responsive trend signals with built-in volatility sensitivity, this tool highlights directional bias, market

Bear Market Probability Model# Bear Market Probability Model: A Multi-Factor Risk Assessment Framework
The Bear Market Probability Model represents a comprehensive quantitative framework for assessing systemic market risk through the integration of 13 distinct risk factors across four analytical categories: macroeconomic indic

Range Filter [DW]This is an experimental study designed to filter out minor price action for a clearer view of trends.
Inspired by the QQE's volatility filter, this filter applies the process directly to price rather than to a smoothed RSI.
First, a smooth average price range is calculated for the basis of the fil

Delta Volume Columns Pro [LucF]█ OVERVIEW
This indicator displays volume delta information calculated with intrabar inspection on historical bars, and feed updates when running in realtime. It is designed to run in a pane and can display either stacked buy/sell volume columns or a signal line which can be calculated and dis

BERLIN CandlesA problem with Heikin Ashi is that while it gives you a great overview of overall direction, it is rarely possible to use it as a replacement for normal japanese
candlesticks. The reason for this is that actual price data is lost, since the candles are more akin to a moving average than a different

Support Resistance ChannelsHello All,
For Long time I was planning to make Support/Resistance Channels script, finally I had time and here it is.
How this script works?
- it finds and keeps Pivot Points
- when it found a new Pivot Point it clears older S/R channels then;
- for each pivot point it searches all pivot po

MathSpecialFunctionsConvolve1DLibrary "MathSpecialFunctionsConvolve1D"
Convolution is one of the most important mathematical operations used in signal processing. This simple mathematical operation pops up in many scientific and industrial applications, from its use in a billion-layer large CNN to simple image denoising.
___

See all indicators and strategies
News didn't load
Looks like that didn't go very well. Let's try again.
Community trends
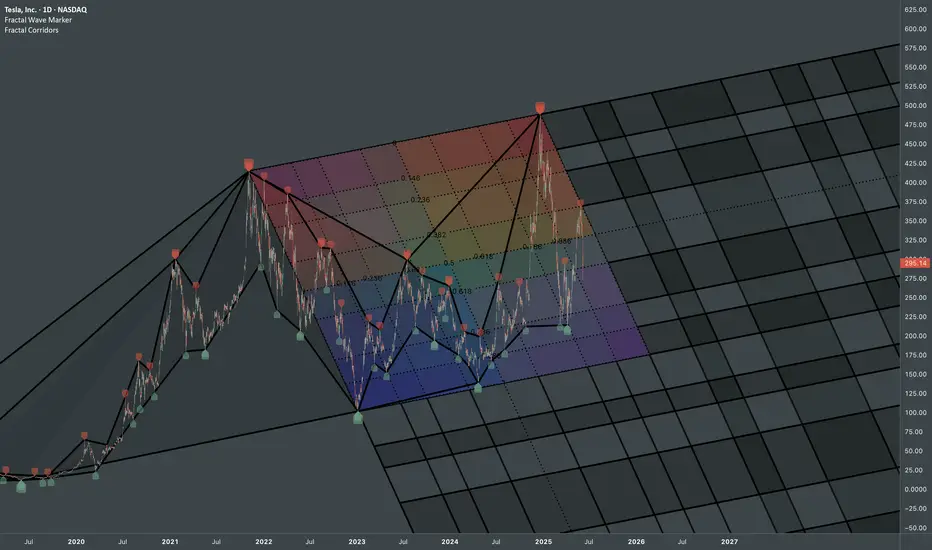
Tesla: Interconnected ATHsStructural update to:
Chronologically connecting pivots via fib channels creates a probabilistic map that captures the rhythm and scale relationships inherent in systematic price movements.
Fractal Wave Marker & Fractal Corridors were used to transform raw price data into a coherent, multis
Elon Musk vs Trump: Who you betting on?Elon Musk and Donald Trump have recently had a public falling-out, with their feud playing out on social media and in political circles.
The dispute seems to have started over Trump's new budget bill, which Musk has criticized for increasing the national debt. Trump, in turn, accused Musk of being
NvdaRising wedge just like Qqq, Spy, and most of tech sectors...
Price should begin the decline down to 112.00 with a pit stop first at 128 or 200ma ..
I expect a dead cat bounce there back to 134 before the next leg down
As you can see here looking at the Chip sector SMH
You have a similar Risi

6/6/25 - $lulu - Buy $260s, but not "need" to own6/6/25 :: VROCKSTAR :: NASDAQ:LULU
Buy $260s, but not "need" to own
- stock is objectively a buy here in the $260s, let's get that out of the way
- but when it comes to "what can happen next" or "what's the floor/drawdown", i think a few considerations
- flat EPS guide in '25 is not bc of structu

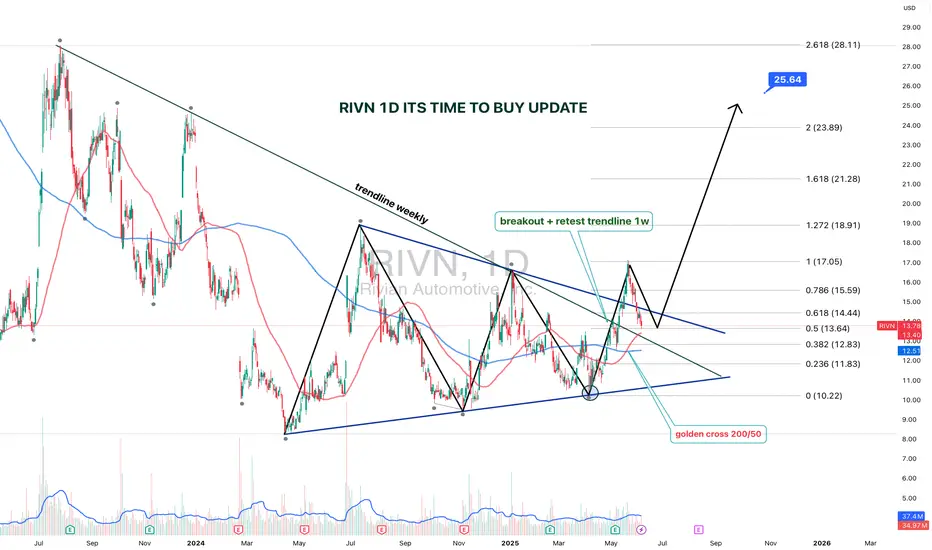
RIVN 1D — It’s Time to Buy: Setup UpdateThe setup on Rivian (RIVN) just got upgraded from “interesting” to “strategically significant.” We’re looking at a textbook symmetrical triangle that’s been developing since July 2023, with a clean breakout and retest on the weekly trendline.
The breakout was followed by a bullish retest, right at
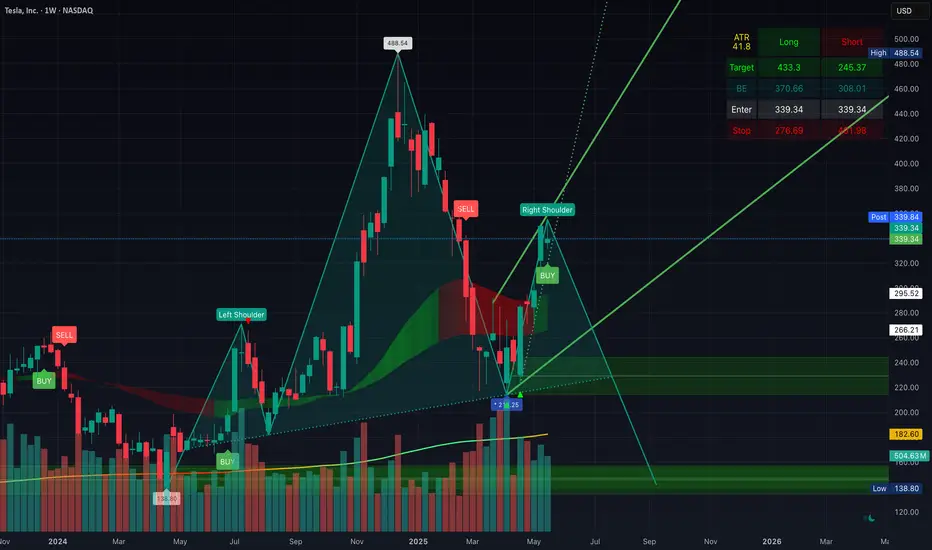
Potential Head & Shoulder Forming On The WeeklyPotential Head & Shoulder Forming On The Weekly... Facing still resistance at the $350 area, and should retest support at $280 within the coming days/weeks. If 280 breaks, should retest $240 (the h&s neckline) and could crash to $100 if that doesn't hold.
Time to take profit/hedge imo
TESLA RECOVERY AHEAD|LONG|
✅TESLA lost more than 25%
On the Elon VS Trump fallout
In less than a week which is
Seen by many as an excellent
Opportunity to add TESLA stocks
To their portfolios with a great
Discount which is why we are
Already seeing a nice rebound
From the wide strong horizontal
Support just above 270

GAME CRACK!GAME is one of the easiest stocks to short.
Just wait for the bearish signal and take the trade. Over and over and over again.
Anyone who wishes to learn what Bull Traps are should study GME chart.

Netflix (NFLX) RSI Bearish Divergence Setting Up Major Rever📈 Summary:
Netflix has rallied +44% in just 60 days, entering a steep, parabolic move. However, technical exhaustion signs are now flashing across multiple indicators — suggesting a potential near-term top may be forming.
🔍 Key Technical Observations:
1. Bearish RSI Divergence
The

GLD Swing Setup – Long Call Into Gold’s Weekly Strength🪙 GLD Swing Setup – Long Call Into Gold’s Weekly Strength
📆 Date: June 6, 2025
📈 Outlook: Moderately Bullish (14-day swing)
📊 Strategy: Long call aiming for continuation above key resistance
🔍 Model Consensus
Model Bias Strike Entry Target(s) Stop Confidence
Grok Mod. Bullish 311C 3.90 5.07 1.95 70

See all stocks ideas
Jun 9
GHMGraham Corporation
Actual
—
Estimate
0.18
USD
Jun 9
PODCPodcastOne, Inc.
Actual
—
Estimate
−0.04
USD
Jun 9
KIRKKirkland's, Inc.
Actual
—
Estimate
−0.47
USD
Jun 9
MPAAMotorcar Parts of America, Inc.
Actual
—
Estimate
0.20
USD
Jun 9
PREPrenetics Global Limited
Actual
—
Estimate
−0.80
USD
Jun 9
DAKTDaktronics, Inc.
Actual
—
Estimate
0.15
USD
Jun 9
VNCEVince Holding Corp.
Actual
—
Estimate
−0.48
USD
Jun 9
VFSVinFast Auto Ltd.
Actual
—
Estimate
−0.28
USD
See more events
News didn't load
Looks like that didn't go very well. Let's try again.
Community trends
BITCOIN → Correction. The hunt for liquidity...BINANCE:BTCUSDT.P is recovering after liquidity was captured in the 100K zone. Locally, the technical situation is controversial despite the global bullish trend
Bitcoin is changing its market character (106700) and breaking the bullish structure (103000) during a correction phase. As part of

Bitcoin - Secret pattern no one talks about, drop below 100k!The price of Bitcoin is currently in a downtrend. We can see that the price is inside this secret descending channel that really no one talks about. As long as we are in this channel, Bitcoin remains bearish, and we can expect a huge drop in the short term! So what is the plan?
Currently I recommen

Ethereum Breakdown Ahead? Classic Head & Shoulders Pattern Hello Guys!
Ethereum looks like it’s setting up for a potential drop after forming a textbook Head & Shoulders pattern on the 4H chart.
This pattern (marked clearly with a left shoulder, head, and right shoulder) is often seen before a price reversal. Right now, ETH has already broken below the ne

Bitcoin’s Reversal from Supports — Is the Correction Over? Bitcoin ( BINANCE:BTCUSDT ) moved as I expected in the previous idea , and it also reversed the decline I intended and started to rise from the Support zone($102,000-$107,120) , Support lines , and 50_SMA(Daily) .
Bitcoin is trading near the Resistance zone($104,380-$103,670) , Cumulative S

TradeCityPro | Bitcoin Daily Analysis #109👋 Welcome to TradeCity Pro!
Let’s dive into the Bitcoin analysis and key crypto indicators. As usual, I’ll walk you through the futures triggers for the New York session.
⏳ 1-Hour Timeframe
In the 1-hour chart, as you can see, yesterday Bitcoin activated the short trigger at 103899 and dropped belo

Biggest Altcoin Season of this Bull Cycle is Coming! As you can see, there is a Massive Ascending Broadening Wedge forming on the #Bitcoin Dominance!
Currently dominance is located almost near the top of the wedge. More likely we will see its ascend up to 67% which will be marked as top before the dump.
The breakdown of this wedge will signal a beg

Bitcoin - We have to see new highs now!Bitcoin - CRYPTO:BTCUSD - is now at the previous highs:
(click chart above to see the in depth analysis👆🏻)
It could really not be more exciting on Bitcoin at the moment. With the current "all or nothing" potential breakout or double top creation, we will either see a bullrun or a bear market.

Ethereum, Guessing The Next Move ($1,500 or $2,000?)The million dollars question; What about Ethereum, lower or recovery?
And this is truly a million dollars question because knowing the answer can make you millions. It can either safe you lots of money or it can make you lots of money.
👉 Ethereum is going lower.
The 18-May low happened at $2,32

TRUMPUSDT price analysis✊ It seems that the price of $Trump will only skyrocket when #Trump is impeached!
And we're keeping our fingers crossed that this happens as soon as possible... Mr. #Musk, you have nothing to lose — spill the beans!
As a Ukrainian classic wrote: “I gave birth to you — I will kill you.”
🕯 As for t

BTCUSD: Just hit the 1D MA50 and is rebounding.Bitcoin turned neutral on its 1D technical outlook (RSI = 51.000, MACD = 923.400, ADX = 25.014) as it hit its 1D MA50 for the first time since April 19th. That is a straight up buy signal, especially since the the current Channel Up with its 1D RSI HL structure, resembles September - December 2024.

See all crypto ideas
News didn't load
Looks like that didn't go very well. Let's try again.
GOLD → Intra-range strategy. Waiting for NFPFX:XAUUSD remains consolidated in the 3340-3391 range. The price is stuck in the middle of the range due to the uncertainty created by upcoming unemployment news...
On Friday, gold rose slightly, remaining within the range ahead of important US employment data (NFP), which could set the directio

GOLD ROUTE MAP UPDATEHey Everyone,
A great finish to the week with our 1H chart idea finishing off with the rejection from 3389 with no further cross and lock above that level confirming the rejection. We continued to see a drop into the lower Goldturns with each level giving 20 to 40 pip bounces.,
We are now seeing 3

Gold will make impulse up from support line of triangle to 3430Hello traders, I want share with you my opinion about Gold. Some days ago, price entered to triangle, where it made an upward impulse at once to the resistance line, breaking the resistance level. But then price turned around and in a short time declined back, breaking the resistance level one more

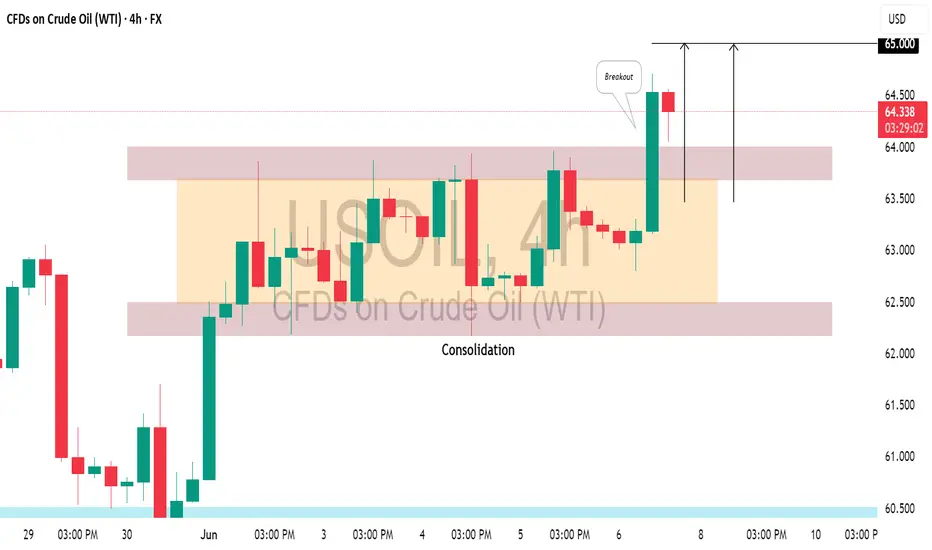
US CRUDE OIL(#WTI) : Bullish Trend Continues📈USOIL is trading in a bullish trend on a 4H time frame.
After a prolonged upward movement, it started to consolidated within a horizontal range for a while.
Recently, the resistance of this range was breached, indicating strong buyer momentum.
I believe the upward movement may persist, potentia
Gold Rejected Below $3370 — Eyes on Lower Demand Zones! (READ)By examining the gold chart on the 4-hour timeframe, we can see that after our previous analysis, the price climbed to $3388, giving us nearly 150 pips of return. However, gold was rejected from that level and failed to hold above $3370, eventually dropping below $3360.
Currently, gold is trading a

Lingrid | GOLD trend Continuation Targets April High RetestOANDA:XAUUSD has reclaimed the 3,350 level following a successful retest of the upward trendline, sustaining a bullish channel structure. After multiple breakouts and a clean consolidation above previous resistance, price is setting up for a potential move toward the 3,500 mark. A pullback and boun

Gold Rejected at Resistance, Targets $3,305 & Below Gold ( OANDA:XAUUSD ) rose to $3,400, as I expected in my previous idea .
Gold is trading near the Resistance zone($3,387-$3,357) and has failed to break the resistance zone validly .
In terms of Elliott Wave theory , it seems that Gold has managed to complete the microwave 5 of the ma

GOLD - Price can drop to support line of triangle patternHi guys, this is my overview for XAUUSD, feel free to check it and write your feedback in comments👊
In this chart price formed a triangle pattern, where it first declined to support line and then made an impulse up.
After this, Gold broke $3165 level and, after a small correction reached and broke

THE KOG REPORT - UpdateEnd of day update from us here at KOG:
It's been a decent week on the markets with our path and red boxes playing well from the low to the high for the pull back trade into the region we wanted and then the long completing all but one Red box target which was missed by 20pips.
With NFP tomorrow

XAUUSD Analysis: Potential Pullback and ContinuationOANDA:XAUUSD is currently trading within an ascending channel, reflecting a clear bullish structure.
Price may return to the lower boundary of the channel before potentially continuing higher. This dynamic support provides a confluence zone for a possible bullish reaction. A successful retest here

See all futures ideas
News didn't load
Looks like that didn't go very well. Let's try again.
USD/JPY - Triangle Breakout (06.06.2025)The USD/JPY pair on the M30 timeframe presents a Potential Buying Opportunity due to a recent Formation of a Triangle Pattern. This suggests a shift in momentum towards the upside and a higher likelihood of further advances in the coming hours.
Possible Long Trade:
Entry: Consider Entering A Long

EUR/USD - After taking the highs, are the lows next?The EUR/USD currency pair is moving between two important price levels. The top level is 1.1454 and the bottom level is 1.1357. This means the price is staying inside a range. Yesterday, the price of EUR/USD went above the top level of 1.1454. By doing this, it triggered many stop-loss orders from t

EURUSD Analysis – Short Bias Builds on Key Resistance RejectionEURUSD pair is currently testing a critical resistance zone around 1.1495–1.1500, with bearish rejection beginning to form on the 4H timeframe. The technical setup suggests a potential lower high forming within the context of a broader downtrend, supported by a confluence of horizontal resistance an

GBP/USD.2H chart pattern.here's a breakdown of the GBP/USD 2-hour chart setup and the target points indicated:
🔍 Technical Analysis Summary
Pair: GBP/USD
Chart timeframe: 2h
Indicators used: Ichimoku Cloud, Trendline (Support), Risk-to-Reward box
Setup: Bearish break of trendline support
Direction bias: Short (Sell)

Trading Signals for EUR/USD buy above 1.1393 (200 EMA - 6/8 Early in the European session, the euro is trading around 1.1422, undergoing a technical correction after reaching the psychological level of 1.15.
The US Non-Farm Payrolls dat will be released in the American session, and strong volatility will hit the market. If the market reacts favorably to th

NZD/USD..4h chart pattern..NZD/USD sell position. Here's a structured breakdown of my trade setup and some considerations:
---
🟡 Current Trade Details
Position: Short (Sell)
Entry: 0.60400
Resistance (Stop loss area): 0.60600
Targets:
🎯 TP1: 0.59600
🎯 TP2: 0.58950
🎯 TP3: 0.58450
---
📊 Trade Analysis
🔻 Bearish

USDCAD → One step away from distributionFX:USDCAD is recovering amid the dollar's growth. Unemployment news is ahead. A return of the price to the buying zone may support the currency pair.
Against the backdrop of the dollar's growth, a change in the market phase is forming (unconfirmed). The price has stopped updating lows and is f

EURJPYDamn! Clean trade for the week...Eurjpy went bullish as anticipated on the previous week ..Smooth Bull run as anticipated... Adios!

GBP-JPY Free Signal! Sell!
Hello,Traders!
GBP-JPY made a retest of
The strong horizontal resistance
Of 196.260 and the pair seems
To be locally overbought
So we will go short with
The Take Profit of 195.525
And the Stop Loss of 196.455
Sell!
Comment and subscribe to help us grow!
Check out other forecasts below too!

USDCAD Looking Solid Buy zoneUSD/CAD is currently in a potential buying zone, supported by the broader strength of the US dollar. While the support level appears to be holding, a clear confirmation is still lacking. A shift in market phase may be forming, but it remains unconfirmed at this stage.
Key Points to watch
Resistanc

See all forex ideas
| - | - | - | - | - | - | - | ||
| - | - | - | - | - | - | - | ||
| - | - | - | - | - | - | - | ||
| - | - | - | - | - | - | - | ||
| - | - | - | - | - | - | - | ||
| - | - | - | - | - | - | - | ||
| - | - | - | - | - | - | - | ||
| - | - | - | - | - | - | - |
News didn't load
Looks like that didn't go very well. Let's try again.
Trade directly on the supercharts through our supported, fully-verified and user-reviewed brokers.


