


Quick updateSP500 and Gold both consolidating, not much action but I think we may see some movement overnight

/
The best trades require research, then commitment.
$0 forever, no credit card needed
Where the world does markets
Join 100 million traders and investors taking the future into their own hands.

Use a Top Down Approach to gather as much CONFLUENCE as possibleAll the information you need to find a high probability trade are in front of you on the charts so build your trading decisions on 'the facts' of the chart NOT what you think or what you want to happen or even what you heard will happen. If you have enough facts telling you to trade in a certain dir

Stocks Have Been in a Bear Market for 25 Years, By This MeasureThe S&P 500 hit a new all-time high in February. However, by one measure it’s been in a bear market all century.
Today’s monthly chart shows SP:SPX as a ratio against gold. Using this comparison, equities have underperformed since Bill Clinton was still President in August 2000.
It illustrates h

The break-up (a must-watch chart)One of the most important—and unusual—developments in the market right now is the combination of rising US bond yields and a falling US dollar.
Normally, when bond yields go up, the dollar strengthens. It's similar to a high-interest bank account: if you can earn more by holding US assets, global i

US10Y Technical Breakdown – Post-Moody’s DowngradeMoody’s has downgraded the US credit rating for the first time since 2011, citing rising debt levels and long-term fiscal challenges.
This move sends a clear warning signal about America’s fiscal path and adds fresh uncertainty to markets already navigating interest rates, inflation, and geopoliti

AUD/USD Sentiment Sours (But There May Better Shorts)Asset managers increased their net-short exposure last week - and as these are 'real money' accounts, they are a group of traders worth listening to. But as always, timing as key, and there may be better setups for bears than AUD/USD over the near term. Today I pick out for AUD crosses to consider.

UJ Could Tumble Back To 140 If Bears Take Expanding RangeToday FX:USDJPY Sellers make a Breakout of the Rising Support of the Expanding Range it's been trading in since the Low that started the range back on April 22nd.
An Expanding Range is typically considered a Continuation Pattern suggesting that if Sellers can hold price under the Rising Support,

Usd/Jpy intra-day Analysis 20-May-2025Disclaimer: easyMarkets Account on TradingView allows you to combine easyMarkets industry leading conditions, regulated trading and tight fixed spreads with TradingView's powerful social network for traders, advanced charting and analytics. Access no slippage on limit orders, tight fixed spreads, ne

5-20-25 WARNING : Bitcoin Sets Up MASSIVE Double-Top WarningI highlighted this incredible price/technical pattern in my morning Plan Your Trade video. But, I thought it was important enough to create a separate video highlighting this incredible Double-Top warning and to try to tell all of my followers to start actively protecting capital over the next 2-3+

3 Reasons Arista Networks Could Soon Rally SignificantlyIn 2023, we covered Arista Networks NYSE:ANET , calling it part of the internet’s "bedrock" but rating it a Hold due to valuation concerns. Since then, ANET has outperformed the S&P 500, proving our call wrong.
Recently, ANET’s stock has dipped alongside broader market declines. However, we belie

See all editors' picks ideas
Trend Volatility Index (TVI)Trend Volatility Index (TVI)
A robust nonparametric oscillator for structural trend volatility detection
⸻
What is this?
TVI is a volatility oscillator designed to measure the strength and emergence of price trends using nonparametric statistics.
It calculates a U-statistic based on the Gini mea

Cointegration Heatmap & Spread Table [EdgeTerminal]The Cointegration Heatmap is a powerful visual and quantitative tool designed to uncover deep, statistically meaningful relationships between assets.
Unlike traditional indicators that react to price movement, this tool analyzes the underlying statistical relationship between two time series and

Bloomberg Financial Conditions Index (Proxy)The Bloomberg Financial Conditions Index (BFCI): A Proxy Implementation
Financial conditions indices (FCIs) have become essential tools for economists, policymakers, and market participants seeking to quantify and monitor the overall state of financial markets. Among these measures, the Bloomberg

TASC 2025.06 Cybernetic Oscillator█ OVERVIEW
This script implements the Cybernetic Oscillator introduced by John F. Ehlers in his article "The Cybernetic Oscillator For More Flexibility, Making A Better Oscillator" from the June 2025 edition of the TASC Traders' Tips . It cascades two-pole highpass and lowpass filters, then sca

Dynamic Volume Clusters with Retest Signals (Zeiierman)█ Overview
The Dynamic Volume Clusters with Retest Signals indicator is designed to detect key Volume Clusters and provide Retest Signals. This tool is specifically engineered for traders looking to capitalize on volume-based trends, reversals, and key price retest points.
The indicator seamles

Multi-Layer Volume Profile [BigBeluga]A powerful multi-resolution volume analysis tool that stacks multiple profiles of historical trading activity to reveal true market structure.
This indicator breaks down total and delta volume distribution across time at four adjustable depths — enabling traders to spot major POCs, volume shelves,

pymath█ OVERVIEW
This library ➕ enhances Pine Script's built-in types (`float`, `int`, `array`, `array`) with mathematical methods, mirroring 🪞 many functions from Python's `math` module. Import this library to overload or add to built-in capabilities, enabling calls like `myFloat.sin()` or `myIntArra

Best SMA FinderThis script, Best SMA Finder, is a tool designed to identify the most robust simple moving average (SMA) length for a given chart, based on historical backtest performance. It evaluates hundreds of SMA values (from 10 to 1000) and selects the one that provides the best balance between profitability,

Bitcoin Monthly Seasonality [Alpha Extract]The Bitcoin Monthly Seasonality indicator analyzes historical Bitcoin price performance across different months of the year, enabling traders to identify seasonal patterns and potential trading opportunities. This tool helps traders:
Visualize which months historically perform best and worst for

Market Manipulation Index (MMI)The Composite Manipulation Index (CMI) is a structural integrity tool that quantifies how chaotic or orderly current market conditions are, with the aim of detecting potentially manipulated or unstable environments. It blends two distinct mathematical models that assess price behavior in terms of bo

See all indicators and strategies
News didn't load
Looks like that didn't go very well. Let's try again.
Community trends
WC: 33.03 Target: 1800-2400 MOASS: 47k-100K: TICK TOCKIt would be easy to be really hyperbolic with my tone and words right based on the latest price action...but I'm NOT going to be
I am a TRADER and in order to extract profit consistently over time its important to manage the PSYCHOLOGICAL aspect of trading well i.e. your emotions
That's why I goin

What Does Salesforce’s Chart Say Heading Into Earnings?Customer-relationship-management technology giant Salesforce NYSE:CRM will release fiscal Q1 results next Wednesday (May 28). What do CRM’s chart and fundamentals say heading into the report?
Salesforce’s Fundamental Analysis
Next week’s numbers could be key for shareholders, as readers might

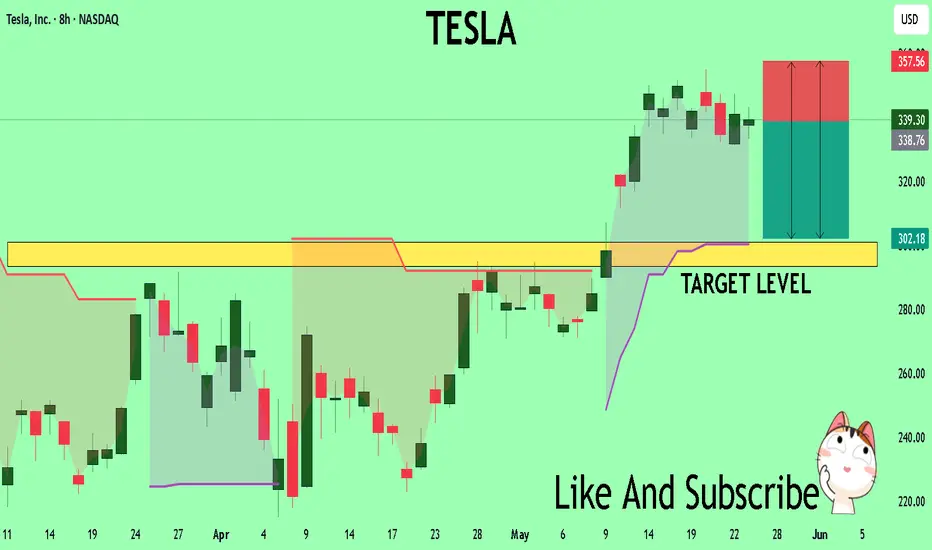
TESLA Massive Short! SELL!
My dear friends,
My technical analysis for TESLA is below:
The market is trading on 339.30 pivot level.
Bias - Bearish
Technical Indicators: Both Super Trend & Pivot HL indicate a highly probable Bearish continuation.
Target - 301.0
Recommended Stop Loss - 357.56
About Used Indicators:
A piv
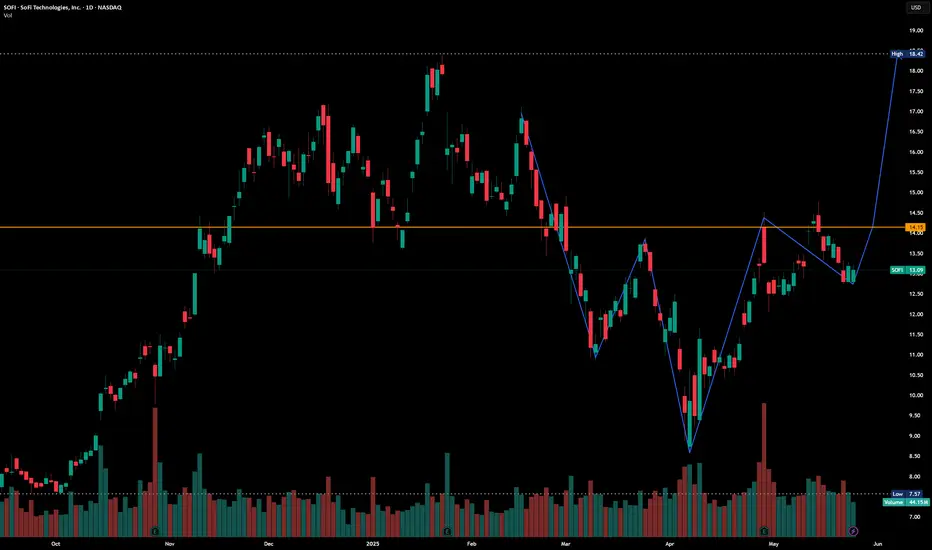
SOFI Charts are interesting.. SOFI is in making of Inverted head and Shoulder pattern. Current market Price is nearly $13. If cross $14.90 and sustain , it may got to $18 and $20.
SMR NNE OKLO – Breakout Setup Triggered by Nuclear CatalystNYSE:SMR is lighting up after Trump’s announcement on nuclear energy — and it’s not alone. NYSE:OKLO and NASDAQ:NNE are also setting up, but NYSE:SMR has one of the cleanest breakout structures on the board.
🔹 Catalyst: Trump’s nuclear energy announcement yesterday is putting serious momentu

LongI would like to inform you all that the 3W is printing money, therefore; I see potential in the higher time frame. I have already bought my calls. Please trade responsibly and know for certain that you will see a decent return on this asset. NFA!

Time to take profits on $QBTS
I Have been bullish on most of the quantum computing stocks for awhile now. NYSE:QBTS
For about a year or so now, trump winning the election didn't change my thoughts at all. I'm not surprised at all that NYSE:QBTS is performing so well however it is important to know when to take profits, an

BlackBerry Crayon DrawingThis is yours to interpret.
Too high to think of a good description.
So here is a quote by William Delbert Gann.
”Time is the most important factor in determining market movements and by studying the past records of the averages or individual stocks you will be able to prove for yourself that hist

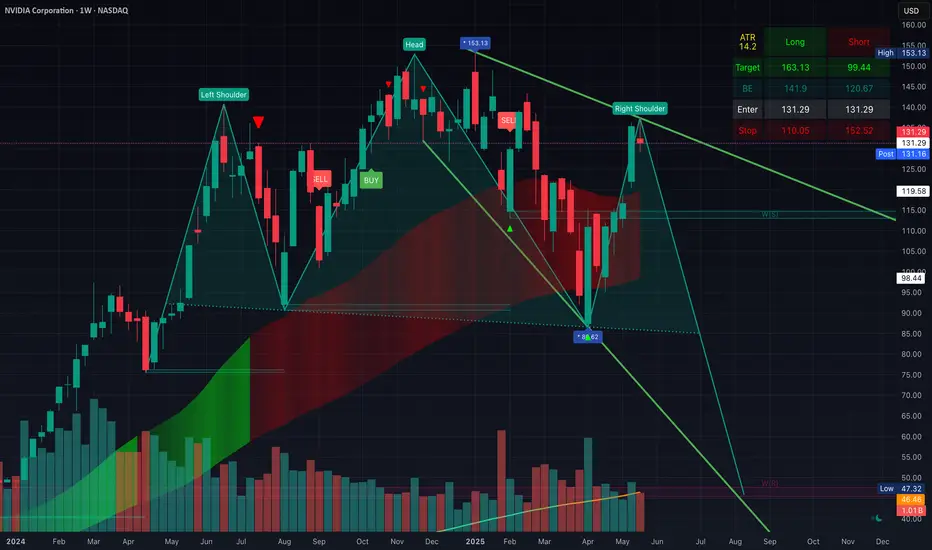
Possible Head & Shoulders Forming On The WeeklyWeekly chart shows a potential H&S forming. Looking for a $120 retest soon minimum. If that breaks, it should retest the March/April lows (also the h&s neckline).... If that doesnt hold, this will plummet to $50 give or take.
Time to take profit/hedge imo
MSTR: Island = Evening StarAnother key detail is that MSTR has gapped down.
And with a gap up on 8 May, the area above is now an island.
If MSTR closes in this area, then if we blended the island into 1 candle, then an Evening Star pattern is printing.
Also considering that this move began with a high momentum upside shake

See all stocks ideas
Tomorrow
BBYBest Buy Co., Inc.
Actual
—
Estimate
1.09
USD
Tomorrow
NATNordic American Tankers Limited
Actual
—
Estimate
0.01
USD
Tomorrow
AVDAmerican Vanguard Corporation
Actual
—
Estimate
−0.03
USD
Tomorrow
NOVASunnova Energy International Inc.
Actual
—
Estimate
−0.89
USD
Tomorrow
GESGuess?, Inc.
Actual
—
Estimate
−0.69
USD
Tomorrow
MANUManchester
Actual
—
Estimate
−0.33
USD
Tomorrow
TGITriumph Group, Inc.
Actual
—
Estimate
0.35
USD
Tomorrow
LZMLifezone Metals Limited
Actual
—
Estimate
−0.12
USD
See more events
Community trends
TradeCityPro | Bitcoin Daily Analysis #100👋 Welcome to the 100th Bitcoin Analysis!
I'm really happy we've shared this 100-day journey together, and I hope you've been able to benefit from these analyses along the way.
💥 Every single analysis I've posted so far has been the basis for real trades that I've taken myself. I'm glad to say the o

Top 10 Altcoins Yet To Move, Strong Growth Potential —CommentI am making a list of TOP 10 Altcoins that are yet to move. These are not the ones with the highest growth potential nor anything like it but a selection of pairs that are yet to move strongly thus low risk vs a high potential for reward.
Let me give you some examples and then I will share the inst

Bitcoin - Bulls vs Bears: $106k or New ATH?Bitcoin saw a sharp and aggressive drop following Donald Trump’s surprise announcement of a 50% tariff on EU imports. The sudden macro shock triggered broad risk-off flows, with BTC quickly selling off from local highs near 111.3K and tapping into a key fair value gap around 107.5K. Although we’ve s

ETH Continues Bullish Momentum Above Broken TrendlineHello guys!
Ethereum has shown a strong bullish rally, breaking through a long-standing descending trendline with significant momentum. Currently, price action is consolidating above the broken trendline, which may now act as a support zone.
🔹 Scenario 1 (Bullish Continuation): If ETH holds above

BITCOIN → False breakout of 110K. Negative background???BINANCE:BTCUSDT.P hit a new all-time high of almost 112K on the back of improved economic and fundamental data, but the party didn't last long before Trump's next speech...
Yesterday, Trump spoke and announced new tariffs on the EU. The markets reacted quite aggressively to this news. Despite

BITCOIN - Price will continue to grow inside rising channelHi guys, this is my overview for BTCUSDT, feel free to check it and write your feedback in comments👊
Price started to grow inside rising channel, where it declined to support line and then bounced up to $93100 level.
BTC broke this level at once and then some time traded near, after which bounced

Lingrid | SHIBUSDT Potential Rally to Key Resistance ZoneBINANCE:SHIBUSDT is consolidating above the key support at 0.00001373, sitting right at the intersection of the upward trendline and a major structure retest. A wedge pattern suggests cooling pressure, with the setup favoring a bullish breakout if buyers step in near this confluence. The key target

BTC - Another Potential Bearish PatternHere I present my second alternative for a Bearish case for Bitcoin.
Per my previous posts I explain in detail the interest in recollecting liquidity in these lower zones. Previously I presented pathways to the uber lows at 7,000-10,000 - however this is another possible case.
I believe Bitcoin

Bitcoin (BTC/USD) 1H Chart Analysis – Double Top Signals BearishPattern Formed: DOUBLE TOP
⚠️ Bearish Reversal Pattern Spotted!
📍 Formed near 111,794.8
⬆️ Price tested the top twice and failed – strong resistance confirmed!
Key Zones:
🔶 SUPPLY ZONE (Resistance):
🟧 111,794.8 - 111,829.8
🔼 Expect selling pressure here!
🔷 SUPPORT Zone (Broken!):
🔻 Price fell be

XMRUSDT broke resistance, waiting for consolidation XMRUSDT is consolidating against the background of an upward (bullish) trend. The coin reacted weakly to yesterday's bitcoin pullback and is testing consolidation resistance with the aim of continuing growth
Scenario: at the moment the price makes a breakout of 401.65. Consolidation of the price a

See all crypto ideas
GOLD increased in the short term: Break down expectedThe Gold market has been very strong for some time, but I don’t think this will continue to be the case going forward. As we’ve seen, the price has rallied a bit on Friday with Trump’s EU tariff threats.
Market structure starts to hint exhaustion, as such overbought conditions often lead to generou

Gold: Bullish Flag Formation Suggests Further Upside Potential Hello guys, let's dive into Gold analysis!
Gold is currently forming a bullish flag pattern, a continuation formation that typically follows a strong upward impulse (flagpole). After a sharp rally, the price consolidated within a downward channel, creating the classic flag structure.
🔍 Technical

Gold may break resistance level and then continue to growHello traders, I want share with you my opinion about Gold. In this chart, price previously formed a clear triangle pattern, where price was squeezed between two converging trend lines. After a period of consolidation, the market broke above this formation, reaching the resistance zone near 3365, bu

Will Trump's Tariffs Propel Gold Past 3,500 ? Again ? On May 23rd's U.S. trading session, Trump's tariff announcements on the EU and Apple roiled markets like a tempest 🌪️. He proposed a staggering 50% tariff on EU products starting from June 1st, citing unfair trade practices. Meanwhile, he threatened Apple with a 25% tariff if iPhones sold in the U.S

GOLD 1. Middle East Tensions: Israel-Iran Conflict
Multiple credible reports indicate that Israel is preparing to strike Iranian nuclear facilities. This has sharply increased market anxiety about a potential escalation in the Middle East, which could provoke retaliation from Iran and destabilize the reg

Critical Resistance Ahead–Will Gold Confirm the Bullish Reversal🔶 What happened last week on Gold (XAUUSD)?
Last week was an excellent one for Gold bulls – the price surged by nearly 1500 pips, fully recovering the drop from the 12–16 May week.
Looking at the chart, the decline from the last ATH at 3500 appears clearly corrective, forming a classic ABC 3-wav

GOLD 1H CHART ROUTE MAP UPDATE & TRADING PLAN FOR THE WEEKHey Everyone,
Please see our updated 1h chart levels and targets for the coming week.
We are seeing price play between two weighted levels with a gap above at 3389 and a gap below at 3352. We will need to see ema5 cross and lock on either weighted level to determine the next range.
We will see le

XAU/USD Outlook: Will Gold Open with a Bullish Gap?XAU/USD Outlook: Will Gold Open with a Bullish Gap?
Date Range: 26th – 30th May 2025
Timeframe: H4 (4-hour chart)
Market Bias: Short-term bullish
🔍 Fundamental Analysis
US–China Trade Tensions:
China halting imports of US goods puts pressure on the dollar (gold tends to move inversely).
Escalatin

XAUUSD..gold 4H chart pattern I’m sharing a trading signal or idea for XAU/USD (Gold vs. US Dollar):
• Buy at 3358
• Target: 3500
• Rationale: Expecting price to touch recent highs again
Let me break it down and offer some considerations:
1. Price Context
• 3358 is a very high level for gold — if this is a real-time signal

XAG/USD Rejection Looming at Key Resistance – Bearish Reversal 🔍 Chart Analysis – XAG/USD
1. Trend & EMAs:
The chart shows two key exponential moving averages:
📈 EMA 50 (Red): 33.1940
📉 EMA 200 (Blue): 32.8684
Price is currently above both EMAs, indicating a short-term bullish trend, but a possible bearish rejection is forming near resistance.
2. Key Zones

See all futures ideas
USD/JPY - H1 - Channel Breakout (17.05.2025) The Pair on the H1 timeframe presents a Potential Selling Opportunity due to a recent Formation of a Channel Breakout Pattern. This suggests a shift in momentum towards the downside in the coming hours.
Possible Short Trade:
Entry: Consider Entering A Short Position around Trendline Of The Pat

USDJPY COT and Liquidity AnalysisHey what up traders welcome to the COT data and Liquidity report. It's always good to go with those who move the market here is what I see in their cards. I share my COT - order flow views every weekend.
🎯 Non Commercials added 6K longs nad just 300 shorts, I still see a price coming higher but, f

USDCAD: Price Approaching Buying Zone, Will DXY Bounce Back? The USDCAD pair has dropped significantly in recent times, particularly as the DXY index has plummeted. The extremely bearish nature of the DXY suggests that the price of USDCAD is melting. Both fundamental and technical indicators indicate a potential bullish price reversal for this pair, which cou

HelenP. I Euro will drop from resistance zone to $1.1260 pointsHi folks today I'm prepared for you Euro analytics. After an extended period of consolidation, the price remained trapped inside a narrow range, testing both the upper and lower boundaries multiple times without any decisive breakout. This indecision created a strong horizontal resistance around the

USDJPY: Long Signal Explained
USDJPY
- Classic bullish setup
- Our team expects bullish continuation
SUGGESTED TRADE:
Swing Trade
Long USDJPY
Entry Point - 142.56
Stop Loss - 141.39
Take Profit - 144.82
Our Risk - 1%
Start protection of your profits from lower levels
Disclosure: I am part of Trade Nation's Influenc

USDCHF Analysis Today: Technical and Order Flow Analysis !In this video I will be sharing my USDCHF analysis today, by providing my complete technical and order flow analysis, so you can watch it to possibly improve your forex trading skillset. The video is structured in 3 parts, first I will be performing my complete technical analysis, then I will be mov

Very Long time Short!Hello all. as you see market was going up because of American Election and Tariffs, but it was just an exciting, it was from no where. then market will go down as sharply as it go up. be happy(wink)

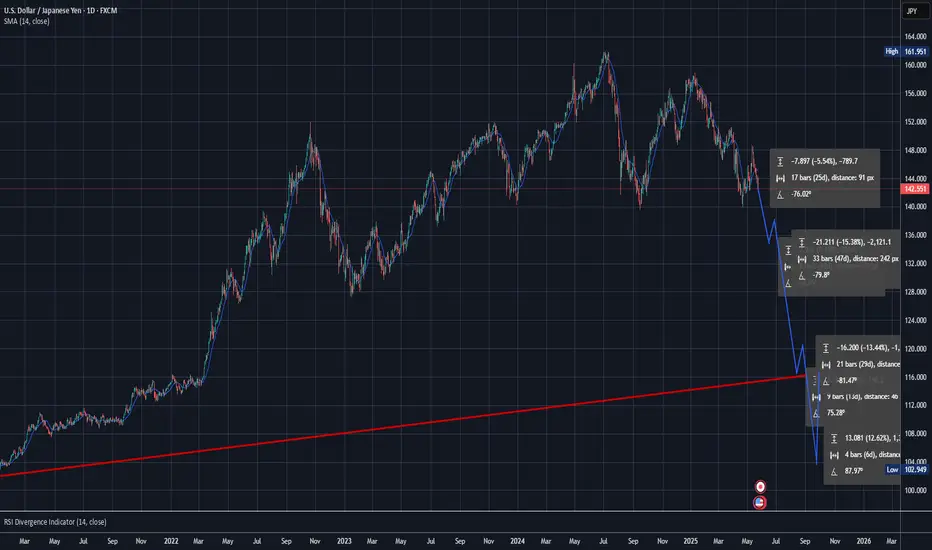
YEN BOTTOMING Look for ABC up back to 144/145The us $ yen trade should now be setup to rally But I can allow one more minor low into,786 But we should begin the final rally up into June 9 to the 16th for support in the carry trade and in SP500 into a seasonal cycle peak . As I have posted the long term chart of a massive Head n shoulde

USD/JPY Breakdown Incoming? 4 Powerful Signals Say 'Short Now'! The current landscape for USD/JPY signals a potential bearish reversal, supported by a convergence of technical, sentiment, and fundamental factors. Following a strong bullish leg from the 140 zone, price has reached the 146–147 resistance area, where it is currently being rejected. Price action has

USDJPY SHORTLooking at USDJPY i am seeing the possibility for some price correction near the support zone that was created in 2021. With the Dollar index showing weakness around this time, it is very likely we will see the USDJPY pair trading under $100 again soon.
#usdjpy
See all forex ideas
| GBP | CHF | |||||||
|---|---|---|---|---|---|---|---|---|
| - | - | - | - | - | - | - | ||
| - | - | - | - | - | - | - | ||
| GBP | - | - | - | - | - | - | - | |
| - | - | - | - | - | - | - | ||
| CHF | - | - | - | - | - | - | - | |
| - | - | - | - | - | - | - | ||
| CNY | - | - | - | - | - | - | - | |
| - | - | - | - | - | - | - |
Trade directly on the supercharts through our supported, fully-verified and user-reviewed brokers.


