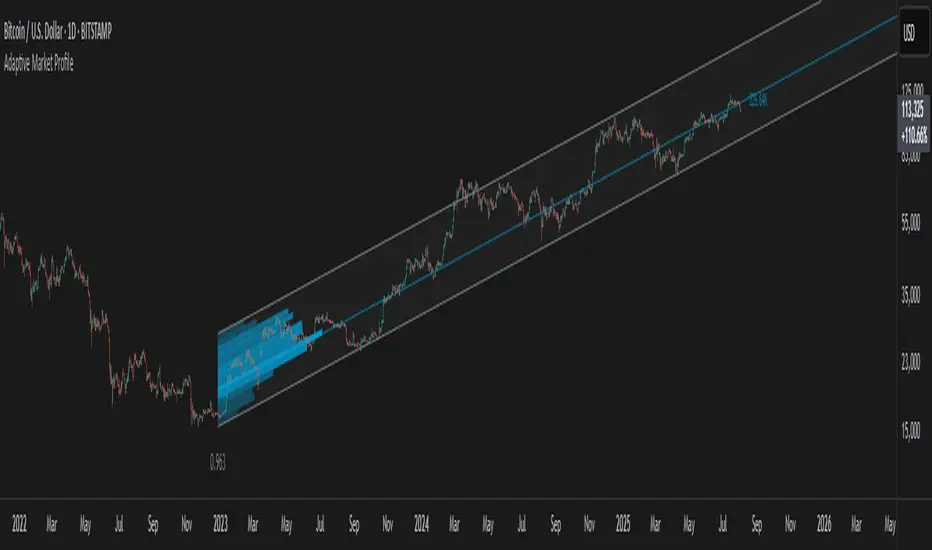
BTC Holding Strong: Fibonacci Levels Point to $130KBITSTAMP:BTCUSD is holding above a key dynamic support zone at the lower boundary of its ascending channel, with current price action signaling a potential continuation to the upside. This long setup is supported by multiple bullish confluences.
✅ Bullish Confluences:
Fibonacci Retracement Suppor

The best trades require research, then commitment.
Get started for free$0 forever, no credit card needed

Scott "Kidd" PoteetThe unlikely astronaut

Where the world does markets
Join 100 million traders and investors taking the future into their own hands.
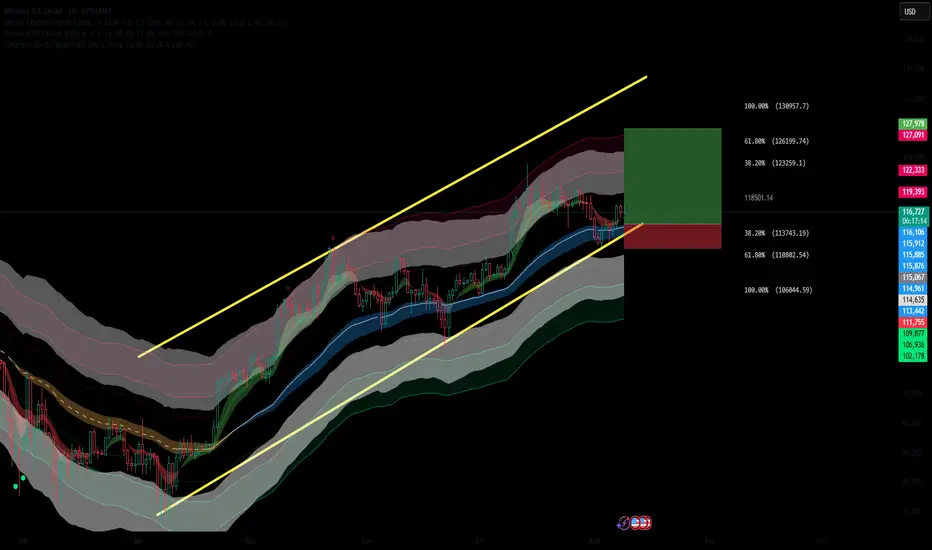
BITCOIN DAILY/4HR THE daily trendline and 4hr trendline break out will be watched for forward guidance.
if we break the top layer resistance we buy and target 123k current all time and high and factor the possibility of 135-130k-128k zone for next sell.
And our sell will be on break of steep ascending trendline a

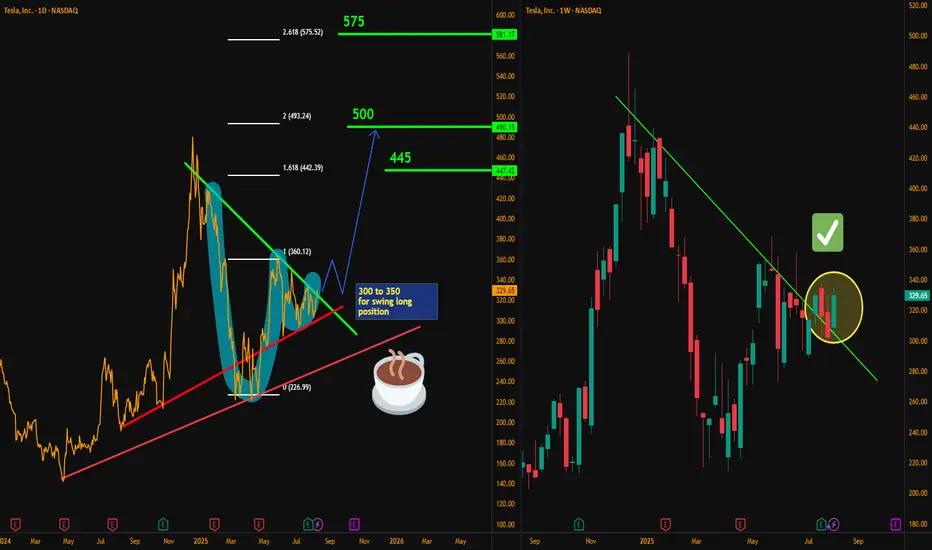
Tesla Roadmap: From $300 Zone to $575Hello traders, here’s my latest analysis on Tesla (TSLA) based on the weekly and daily timeframes. On the weekly chart, I have drawn a downtrend line starting from December 2024, and the recent price action shows a breakout above this line on a weekly close. This breakout is a promising sign that an
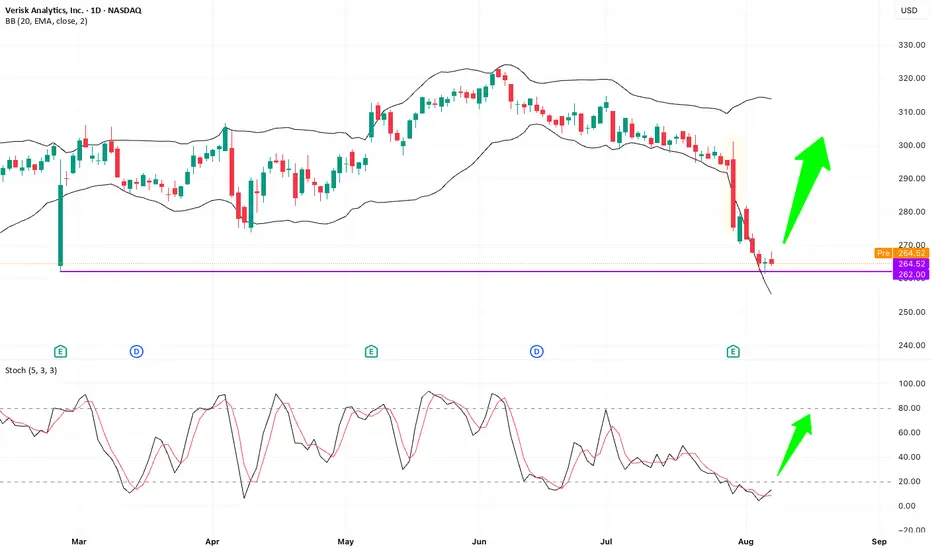
VRSK – Bullish Pin Bar at Key Support after Earnings Flush?NASDAQ: VRSK delivered good quarterly results, yet price action showed a sharp flush-down bar breaking below the lower Bollinger Band. Recently, price retested the key previous low level at $262, triggered some small stop-losses, and closed back at $262 with a bullish small pin bar. Double bottom se
EUR/CAD – 93% Traders Are SHORT! Bearish Reversal Brewing?The EUR/CAD pair is currently in a bullish trend, but multiple technical and sentiment signals are pointing toward a possible trend reversal.
🔍 Key Observations:
Trend: Bullish (but losing momentum)
Bearish Divergence: Price making higher highs while RSI indicators show lower highs.
Pattern:

BILL - 6-10 R:R short-term trade opportunity Here is a multi-time frame analysis and trade idea on BILL. The algorithms are indicating a potential short-term reversal and with a few of our confluences and confirmations, we are able to set up a solid trade.
I left out the weekly view because it's not as relevant for this short-term trade idea

Tesla Stock Gains After Musk Gets $30 Billion Award — What Now?Tesla board is hoping that the pile of shares would be enough to pin down the CEO and lock down his focus. But challenges are there. Here’s one — $30 billion might not be enough to keep Musk around.
💰 $30 Billion Retention Bonus
Tesla stock NASDAQ:TSLA is up about 4% since the start of the we

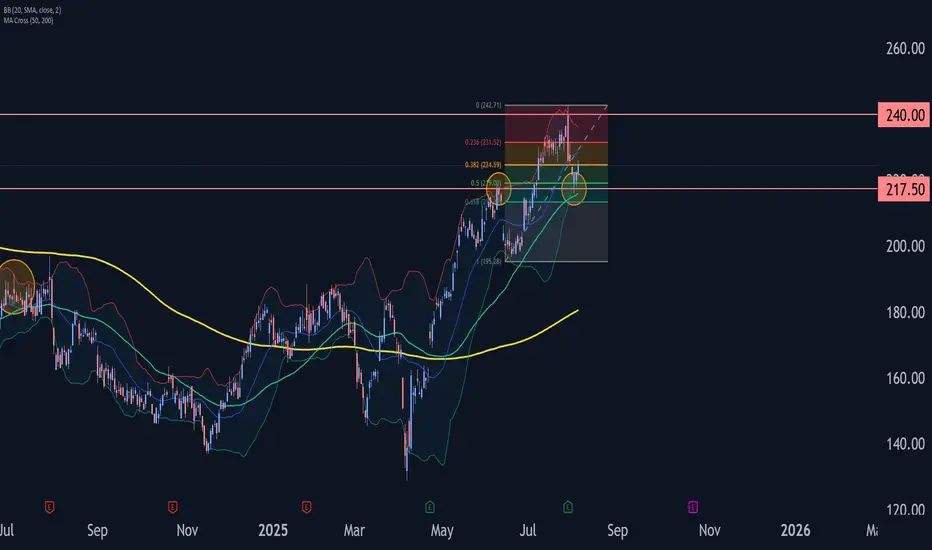
Boeing Wave Analysis – 5 August 2025- Boeing reversed from the support zone
- Likely to rise to resistance level 230.00
Boeing recently reversed up from the support zone between the pivotal support level of 217.50 (former top of wave 1 from June) and the lower daily Bollinger Band.
This support zone was further strengthened by the 5
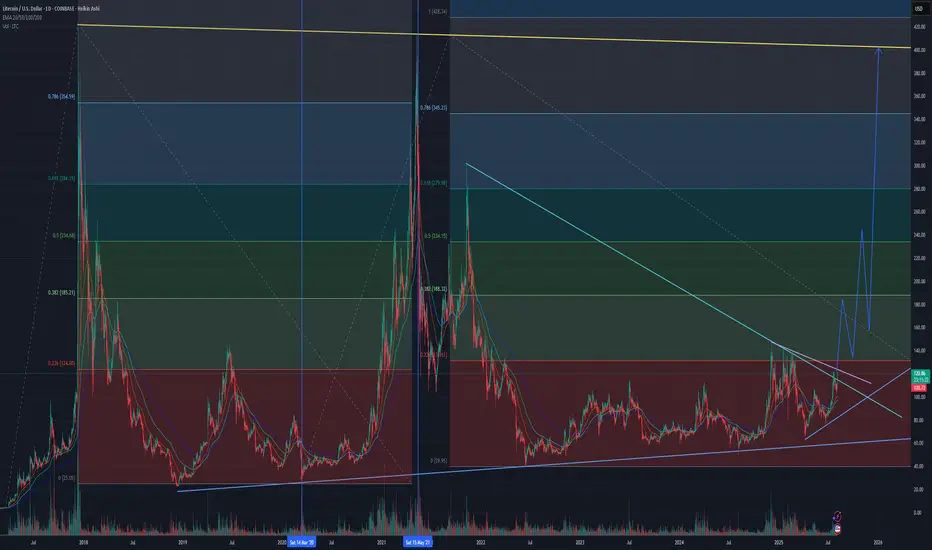
Why Litecoin is my #1 pick right nowObserving the price action between the two vertical blue lines (the '20 to '21 bull cycle), and comparing to the trend based fib extension levels on the left, we have a blueprint for the fib levels that LTCUSD responds to. At the .236 fib, a 24% pullback. At the .382 a 36% pullback. At the .5 a 38%
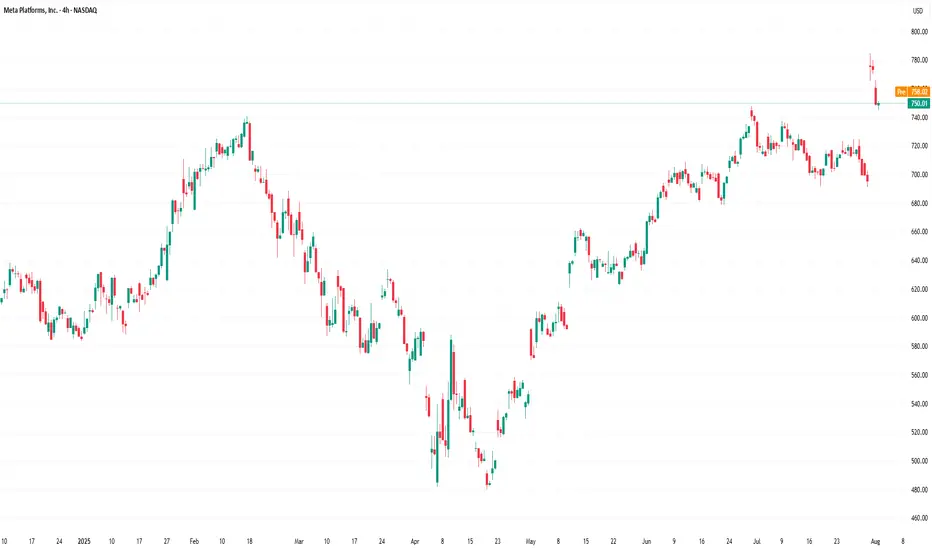
Meta Platforms (META) Shares DeclineMeta Platforms (META) Shares Decline
Shares of the US tech giant Meta Platforms (META) hit a record high last week, climbing above $780 following the release of a strong earnings report:
→ Earnings per share (EPS) came in at $7.14, significantly exceeding the forecast of $5.88.
→ The company also
See all editors' picks ideas
Drawdown Distribution Analysis (DDA) ACADEMIC FOUNDATION AND RESEARCH BACKGROUND
The Drawdown Distribution Analysis indicator implements quantitative risk management principles, drawing upon decades of academic research in portfolio theory, behavioral finance, and statistical risk modeling. This tool provides risk assessment capabilit

FunctionADFLibrary "FunctionADF"
Augmented Dickey-Fuller test (ADF), The ADF test is a statistical method used to assess whether a time series is stationary – meaning its statistical properties (like mean and variance) do not change over time. A time series with a unit root is considered non-stationary and

Adaptive Market Profile – Auto Detect & Dynamic Activity ZonesAdaptive Market Profile is an advanced indicator that automatically detects and displays the most relevant trend channel and market profile for any asset and timeframe. Unlike standard regression channel tools, this script uses a fully adaptive approach to identify the optimal period, providing you
Trading Report Generator from CSVMany people use the Trading Panel. Unfortunately, it doesn't have a Performance Report. However, TradingView has strategies, and they have a Performance Report :-D
What if we combine the first and second? It's easy!
This script is a special strategy that parses transactions in csv format from Paper

Smart Money Breakout Channels [AlgoAlpha]🟠 OVERVIEW
This script draws breakout detection zones called “Smart Money Breakout Channels” based on volatility-normalized price movement and visualizes them as dynamic boxes with volume overlays. It identifies temporary accumulation or distribution ranges using a custom normalized volatility me

Trend Range Detector (Zeiierman)█ Overview
Trend Range Detector (Zeiierman) is a market structure tool that identifies and tracks periods of price compression by forming adaptive range boxes based on volatility and price movement. When prices remain stable within a defined band, the script dynamically draws a range box; when p

BE-Indicator Aggregator toolkit█ Overview:
BE-Indicator Aggregator toolkit is a toolkit which is built for those we rely on taking multi-confirmation from different indicators available with the traders. This Toolkit aid's traders in understanding their custom logic for their trade setups and provides the summarized results o

Synthetic VX3! & VX4! continuous /VX futuresTradingView is missing continuous 3rd and 4th month VIX (/VX) futures, so I decided to try to make a synthetic one that emulates what continuous maturity futures would look like. This is useful for backtesting/historical purposes as it enables traders to see how their further out VX contracts would'

Intrabar Efficiency Ratio█ OVERVIEW
This indicator displays a directional variant of Perry Kaufman's Efficiency Ratio, designed to gauge the "efficiency" of intrabar price movement by comparing the sum of movements of the lower timeframe bars composing a chart bar with the respective bar's movement on an average ba

Strategy█ OVERVIEW
This library is a Pine Script™ programmer’s tool containing a variety of strategy-related functions to assist in calculations like profit and loss, stop losses and limits. It also includes several useful functions one can use to convert between units in ticks, price, currency or a per

See all indicators and strategies
News didn't load
Looks like that didn't go very well. Let's try again.
Community trends
Tesla Roadmap: From $300 Zone to $575Hello traders, here’s my latest analysis on Tesla (TSLA) based on the weekly and daily timeframes. On the weekly chart, I have drawn a downtrend line starting from December 2024, and the recent price action shows a breakout above this line on a weekly close. This breakout is a promising sign that an
Bullish Continuation Based on this strong resistance here around 183.82, there's some strong upside if price breaks through. If it rejects there's light support around 179 and strong support around 178.

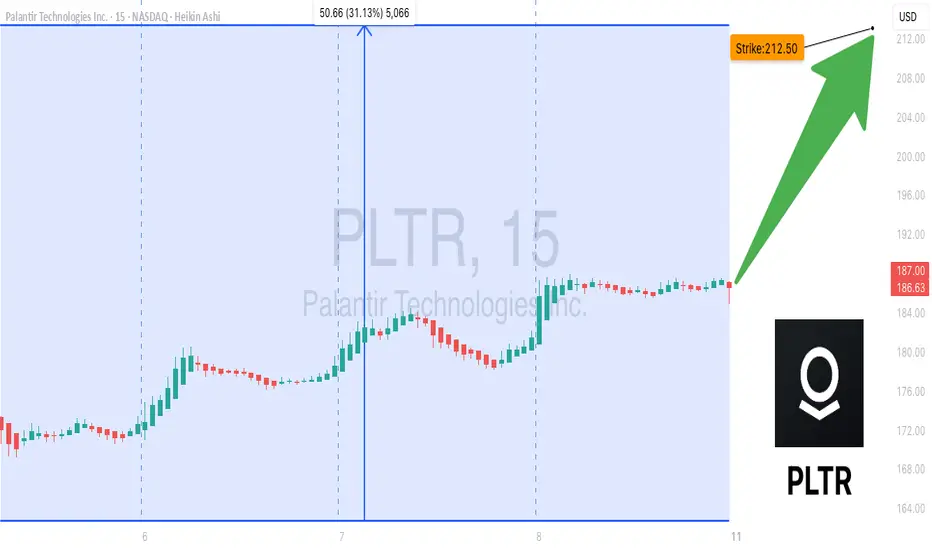
PLTR Bulls Unstoppable? Key Levels You Can’t Ignore! 🚀 PLTR Swing Trade Setup (2025-08-09) 🚀
**Bias:** 📈 **Cautious Bullish** — momentum strong, RSI hot, but volume light = high risk at highs.
**🎯 Trade Plan**
* **Ticker:** \ NASDAQ:PLTR
* **Type:** CALL (LONG)
* **Strike:** \$212.50 (slightly OTM)
* **Entry:** \$0.85 (open)
* **Profit Target:**
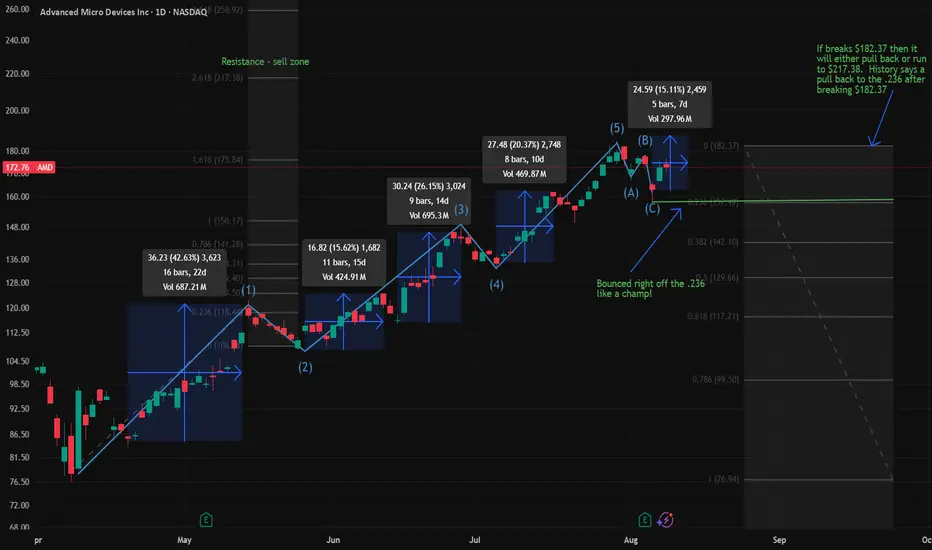
AMD about to Burst?I've been trading calls on AMD for 3 months now and have made over $45k in profit. This is my latest chart to help others gain insight into what I'm seeing. Make sure you do your own research and any news about Tariffs or rates could easily change this outlook. Always to your own research.
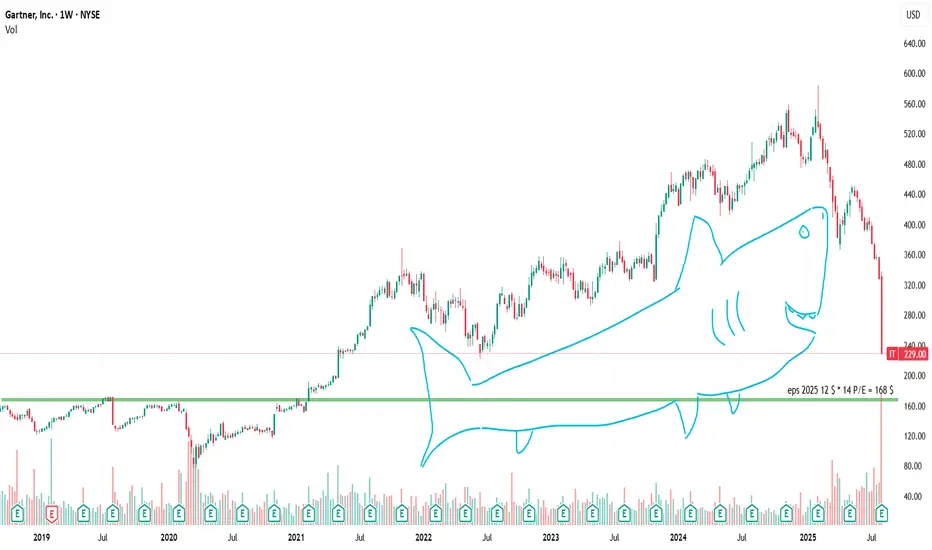
The Shark PatternA “shark pattern” in stock charts is a completely made-up formation where the price action looks like a dorsal fin cutting through calm market waters.
Traders say it signals “blood in the water” — which usually just means your stop-loss is about to get eaten.
Legend has it, if you spot a shark patte
TESLA What Next? SELL!
My dear friends,
My technical analysis for TESLA is below:
The market is trading on 329.70 pivot level.
Bias - Bearish
Technical Indicators: Both Super Trend & Pivot HL indicate a highly probable Bearish continuation.
Target - 319.77
Recommended Stop Loss - 335.01
About Used Indicators:
A p

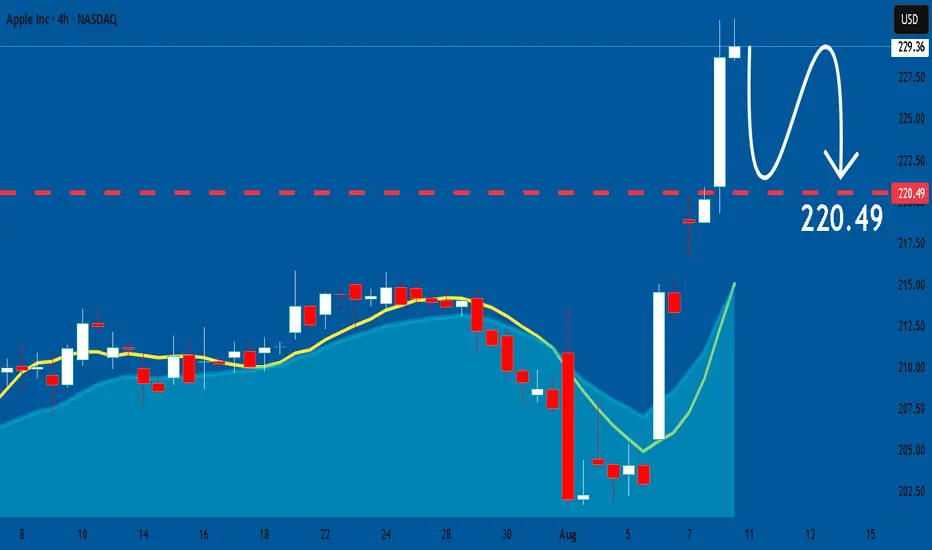
APPLE: Forecast & Trading Plan
Remember that we can not, and should not impose our will on the market but rather listen to its whims and make profit by following it. And thus shall be done today on the APPLE pair which is likely to be pushed down by the bears so we will sell!
Disclosure: I am part of Trade Nation's Influencer
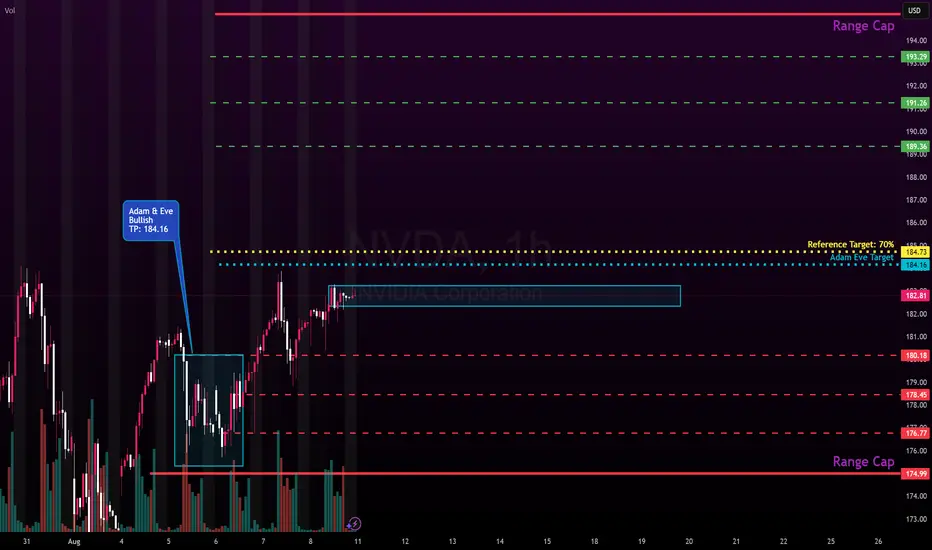
NVDA: Week of Aug 11Expectations for NVDA is.. shocker.. continuation up .
Here is the summary of what to know for next week on NVDA:
Forecasts
Weekly 30 minute: bullish, trending up after initial consolidation into beginning of week.
Weekly hourly: bullish trending up.
Daily for Monday: Rally of
Pltr Looking a major correction here in mid.to late sept. Pullback targets are 120-125.. below 120 and 100 comes .. price bounces off 120 and consolidation then we'll see..
Channel trade until then ..
Channel top this week is 190-191 price should pullback from there

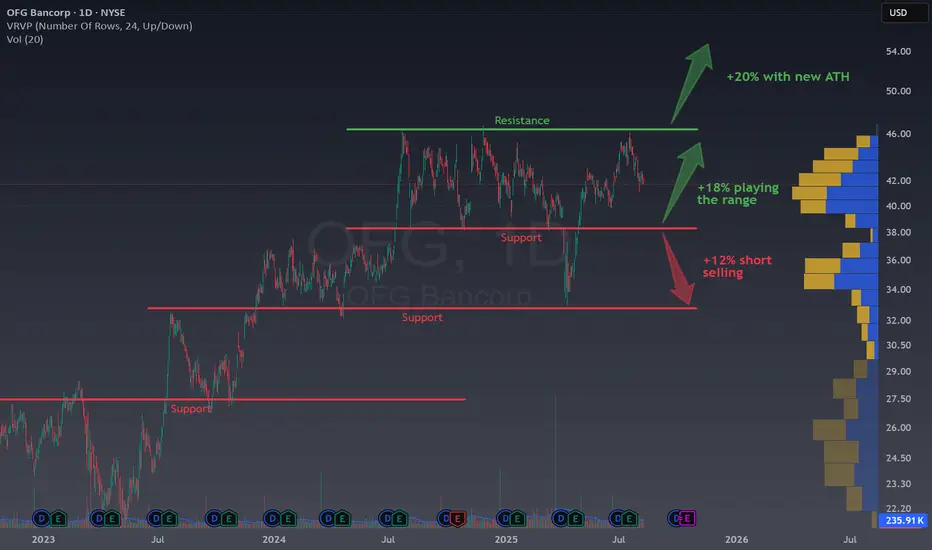
Trading Opportunities with Clear Support and Resistance ZonesTrading Opportunities with Clear Support and Resistance Zones
The daily chart of OFG Bancorp NYSE:OFG is a textbook example of how well-defined support and resistance levels can present multiple high-probability trading opportunities. These technical zones are easily recognizable and offer tra
See all stocks ideas
Aug 10
RDNTRadNet, Inc.
Actual
0.31
USD
Estimate
0.16
USD
Today
DOLEDole plc
Actual
—
Estimate
0.51
USD
Today
OMIOwens & Minor, Inc.
Actual
—
Estimate
0.28
USD
Today
GPREGreen Plains, Inc.
Actual
—
Estimate
−0.33
USD
Today
HBIOHarvard Bioscience, Inc.
Actual
—
Estimate
−0.03
USD
Today
AIOTPowerFleet, Inc.
Actual
—
Estimate
−0.01
USD
Today
ROIVRoivant Sciences Ltd.
Actual
—
Estimate
−0.25
USD
Today
CEVACEVA, Inc.
Actual
—
Estimate
0.05
USD
See more events
News didn't load
Looks like that didn't go very well. Let's try again.
Community trends
Bitcoin Monthly Update + Top Altcoins Choice, Your PickThis is a monthly Bitcoin chart and is really interesting, it supports without a shadow of doubt a strong continuation and bullish bias.
First, the month started red but is now green. This is always a strong signal when the action starts bad but recovers quickly during the month just to end up good

XRPUSDTHello Traders! 👋
What are your thoughts on RIPPLE ?
On the XRP chart, we can see that after breaking the descending trendline and reaching a resistance level, the price has entered a corrective phase.
We expect this correction to continue down toward the support zone, which coincides with the ascen

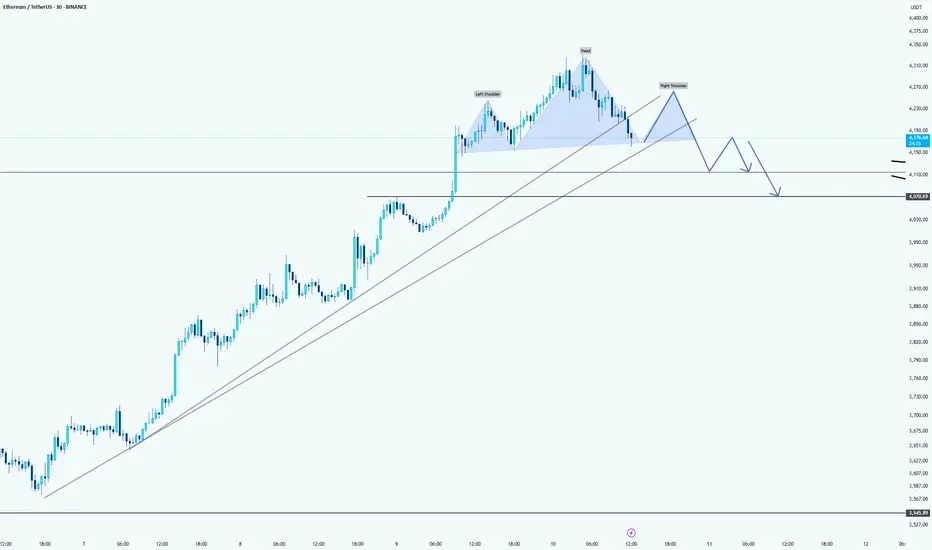
Ethereum: just a little bit correction hereHello guys!
Chart Pattern: Head and Shoulders
The chart shows a Head and Shoulders pattern forming on the Ethereum price action. The trendline drawn across the neckline of the pattern is a crucial support level to monitor.
Potential Breakdown:
If Ethereum fails to hold above the neckline (around
XRPUSDT - Time to be bearish!!Did you know that the XRP chart has turned bearish and is looking pretty grim?
A lot of indicators are pointing in that direction right now.
It recently formed a triangle pattern, broke out, rallied, and hit a new ATH — which coincided with the fifth and final wave of the Elliott Wave impulse.

ETH - Eyes on a New All-Time High?ETHUSDT has been on fire lately, following a textbook bullish structure of Impulse → Fakeout → Impulse.
After breaking above the previous range in July, ETH confirmed strength with a sharp impulse move, only to shake out weak hands via a fakeout retest before pushing higher again. 📈
Currently, ET

BITCOIN - IMPORTANT BREAKOUT !Hello Traders!
The Bitcoin failed to create a new lower low!
The price broke the resistance line!
So, I expect a bullish move🚀
____________
TARGET: 122700🎯

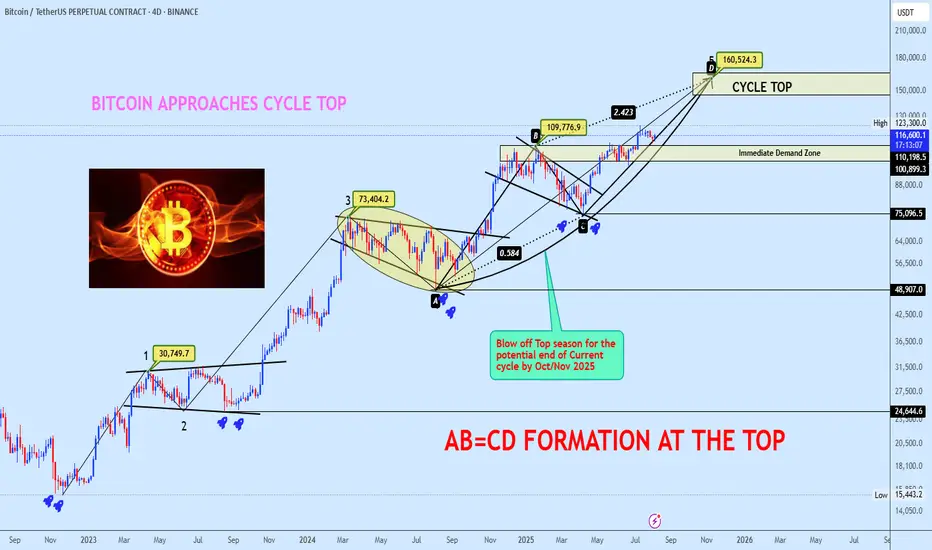
Bitcoin Approaches Cycle Top with AB=CD Completion in SightBTCUSDT continues its bullish macro structure, now advancing towards the projected cycle top zone at $160,524, completing a textbook AB=CD harmonic formation. The BC leg retraced precisely 0.584 of AB, aligning with a 2.423 CD extension, confirming a strong harmonic symmetry.
Price is currently tra
OG more than 4 years of accumulation!OG / USDT
Price is playing in long term accumulation between 2$ as support and 14$/16$ as resistance
Every time price hit resistance zone it rejected hard but once again we see another try to breakout with big volume
Breakout here and we will see fireworks
Keep an eye on it

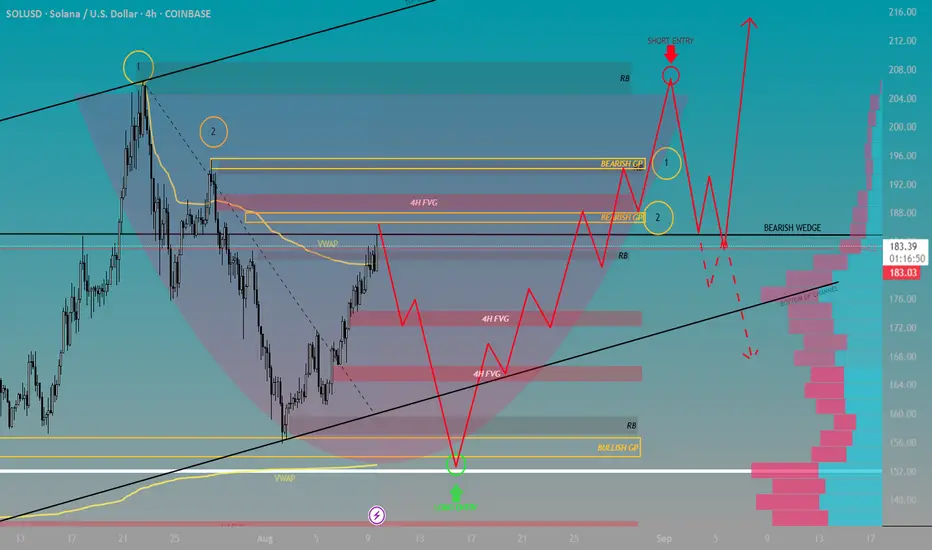
Solana Presents Multiple Opportunities on the HorizonContext 1:
Support: $125.50
Resistance: $185.00
Psychological Levels: $150.00 and $190.00
Context 2:
Technical Structure 1: We are in a bearish wedge that has formed the beginning of a bearish channel that has tested support 3 times and tested resistance 4 times.
FVG’s:
FVG Confluence 1: One bear
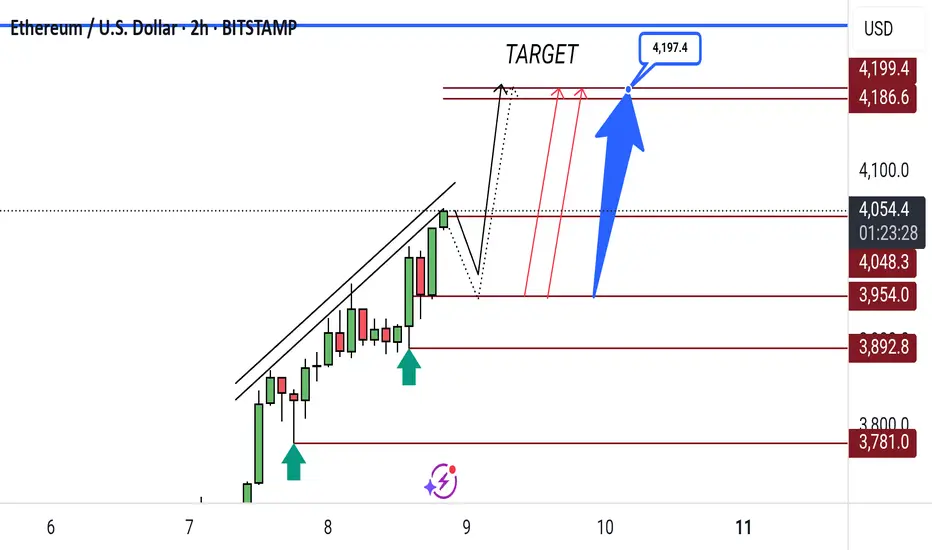
ETH/USD Bullish Breakout Targets 4,197Ethereum (ETH/USD) is showing bullish momentum on the 2H chart, with price targeting the 4,197 level after breaking above the channel. Key supports are at 4,048 and 3,954.
See all crypto ideas
News didn't load
Looks like that didn't go very well. Let's try again.
GOLD 1H CHART ROUTE MAP UPDATE & TRADING PLAN FOR THE WEEKHey Everyone,
Please see our updated 1h chart levels and targets for the coming week.
We are seeing price play between two weighted levels with a gap above at 3403 and a gap below at 3377. We will need to see ema5 cross and lock on either weighted level to determine the next range.
We will see le

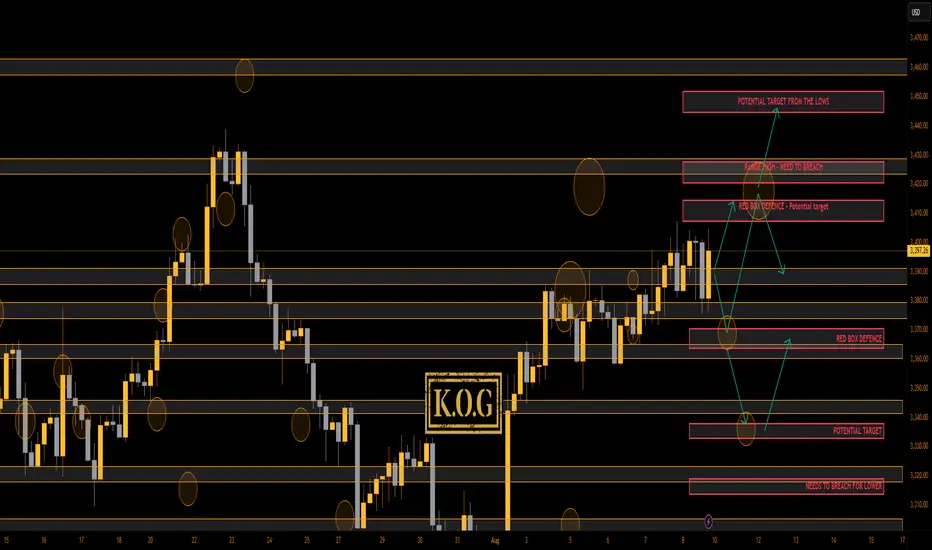
THE KOG REPORT THE KOG REPORT:
In last week’s KOG Report we shared the NFP chart and the KOG Report chart for the wider community. We said we would be looking for price to support below at the red box and then push upside into the higher levels and the red box targets. We also suggested the shorting region and
Lingrid | GOLD Weekly Price Outlook: Uptrend AccelerationOANDA:XAUUSD continues attracting significant buying interest as bulls successfully penetrated key resistance levels during the week. The market demonstrates resilience with bulls consistently stepping in during any price declines, suggesting an ongoing upward trajectory ahead.
The 4H timeframe sh

Gold (xauusd): still bullishHello guys!
Price is moving inside an ascending channel.
Recently bounced from mid-channel support (“last kiss”) and heading toward channel resistance.
Potential upside target: $3,435 zone.
As long as the price stays above mid-line support, bullish momentum remains intact.

GOLD (XAUUSD): Support & Resistance Analysis For Next Week
Here is my latest support & resistance analysis for Gold
Support 1: 3380 - 3390 area
Support 2: 3327 - 3358 area
Support 3: 3246 - 3275 area
Resistance 1: 3431 - 3450 area
With a high probability, the market will continue rising to Resistance 1.
❤️Please, support my work with like, thank you

Candle patterns that help you always WinHello everyone, if you are struggling to identify price zones, entry points, or simply want to predict the trend of any currency pair, then this article is for you.
I will divide it into several parts, and today we will cover some common patterns — so grab a pen and paper to take notes!
First pat
Gold price continues to increase above 3400, next week✍️ NOVA hello everyone, Let's comment on gold price next week from 08/11/2025 - 08/15/2025
⭐️GOLDEN INFORMATION:
Spot gold held steady on Friday, while futures surged to a record high of $3,534 following reports that the United States will impose tariffs on imported gold bars. Traders also continu

XAUUSD TRADE SETUPWait for retest the entry level and bullish momentum candle then take a trade for Buy otherwise skip this setup

GOLD Will Keep Growing! Buy!
Hello,Traders!
GOLD is trading in an
Uptrend and the price
Made a retest and rebound
So we are bullish biased
And we will be expecting
A further bullish move up
Buy!
Comment and subscribe to help us grow!
Check out other forecasts below too!
Disclosure: I am part of Trade Nation's Influen

Gold trapped between 3,400.00 and 3,380 zoneAfter bouncing from 3,268.42 zone, Gold have been showing strong bullish momentum until it found itself between resistance zone 3,400.00 and support zone 3,380.00.
Zones to watch:
Support zones:3,800.00⬇️, 3,500.00⬇️
Resistance Zone:3,400.00⬆️, 3,430.00⬆️
🔎BIAS:
🔼Bullish: Break and hold above 3,40

See all futures ideas
News didn't load
Looks like that didn't go very well. Let's try again.
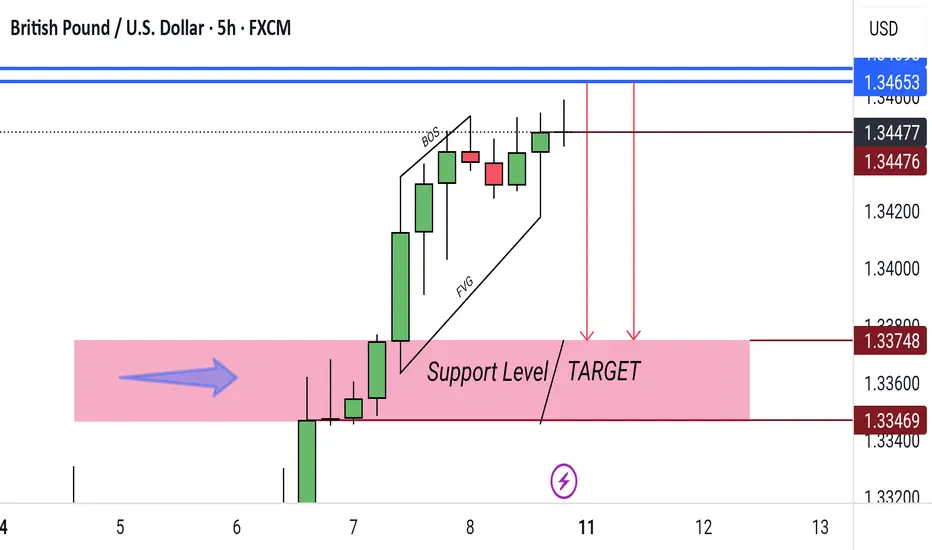
GBP/USD 5H – Bearish Reversal Towards Support ZoneGBP/USD 5H – Price is testing resistance near 1.3465 after a bullish move. A drop towards the 1.3375–1.3346 support zone (target) is anticipated.
AUDUSD: Gold Breakout & DXY Resistance Could Fuel Bulls!!Hey Traders,
In tomorrow’s session, we’re eyeing a buying opportunity on AUDUSD around the 0.65100 zone. The pair remains in an uptrend and is currently in a correction phase, approaching a key support level at 0.65100.
We’re also keeping a bullish bias on Gold, which is attempting to break and hold

EURCHF: Likely pullback at resistanceI am watching for a reversal EURCHF, expecting a rejection with a target at around 0.93550.
This area is where it can become a decision point: either price bounces, or it breaks above and the move can start to go higher.
I'll be watching for confirmation: not just in candlestick structure, but al

EURUSD: Support & Resistance Analysis For Next Week 🇪🇺🇺🇸
Here is my latest structure analysis and important supports & resistances
for EURUSD for next week.
Consider these structures for pullback/breakout trading.
❤️Please, support my work with like, thank you!❤️
I am part of Trade Nation's Influencer program and receive a monthly fee for using th

EURUSD: Are Sellers About To Take Control? CPI May Decide!Welcome back to the Weekly Forex Forecast for the week of Aug 11 - 15th.
In this video, we will analyze the following FX market:
EURUSD
The EURUSD saw a relatively small range of action Friday, forming an Inside Bar for the week. Although it closed bullishly, it did so in the middle of the range

EUR/USD Bullish Breakout SetupEUR/USD on the 1H chart is forming a descending wedge pattern near support. A breakout above resistance could push the price toward the 1.17500 target.

EURUSD Swing Outlook-Update/Market forecast! EU Swing Analysis H8-H4 Timeframe
Overall trend is bullish, on Daily> timeframe price has broken below the support trend line
Which indicates bearish corrective phase has started.
Current PA
Trend is bearish
Phase is corrective
Price has tapped into my 70.5-79.5% Fib level, in premium levels. I

Sell gbpusdBe ready for the big drop coming
Monthly sell structure
Daily resistance trend respecting

BEARISH ON EURUSDStrong bullish push on the Monthly TF and Bearish on DXY, expeting pullback. Daily TF traded into an FVG with indicision candle followed with bearish candle. BOS on 1H TF and pushing down.

GBPUSD Rally at Potential Turning Point :Is a Reversal Imminent?the pound has been making lower highs and lows on the daily chart, signaling a bearish trend. now hitting a key zone where the trendline and a FVG align, it could be set for a reversal and drop back to the bullish OB below

See all forex ideas
| - | - | - | - | - | - | - | ||
| - | - | - | - | - | - | - | ||
| - | - | - | - | - | - | - | ||
| - | - | - | - | - | - | - | ||
| - | - | - | - | - | - | - | ||
| - | - | - | - | - | - | - | ||
| - | - | - | - | - | - | - | ||
| - | - | - | - | - | - | - |
News didn't load
Looks like that didn't go very well. Let's try again.
Trade directly on the supercharts through our supported, fully-verified and user-reviewed brokers.


