Bitcoin Analysis 23-Jun-25Bitcoin price in the weekend retested around 98,500$, this drop was mainly supported by the fear in the markets due to the escalations in the Middle East, & the US taking part in the War.
In this short analysis video, we will be discussing the Areas of interest and possible price movement we coul

The best trades require research, then commitment.
Get started for free$0 forever, no credit card needed

Scott "Kidd" PoteetThe unlikely astronaut

Where the world does markets
Join 100 million traders and investors taking the future into their own hands.

Coffee just gave a two-bar reversal to go long6 23 25 oil just went higher presumably from what happened with Tehran... and I heard several people say that oils going a lot higher. I really don't believe that but more importantly we can use some of the tools on the chart to decide when to take trades as a buyer and a seller. there's a cl

Tesla Rolls Out Much-Awaited Robotaxis. Buy or Sell the Stock?They’re here. After years of tweets, teasers, and timelines that aged like unrefrigerated dairy, Tesla NASDAQ:TSLA officially launched its long-awaited robotaxi service in Austin, Texas.
The self-driving revolution, we were told, would arrive like a lightning bolt. Instead, it quietly rolled up

Will Nike’s Upcoming Earnings ‘Just Do It’ for Investors?This hasn’t been the greatest year for Nike NYSE:NKE , which will report earnings next Thursday at a time when the stock is down more than 20% year to date. What does technical and fundamental analysis say might happen to the stock from here?
Let’s take a look:
Nike’s Fundamental Analysis
NKE

Is Alt season dead? - June 2025Let me start by saying, Youtube influencers are lying to you. The collective narrative (from those links shared with me) talk almost exclusively about the same set of narratives for triggering “alt season”:
M2 money supply. The printer will be turned on any minute.
The FED is going to cut rat

Bitcoin Long: Going for Final Wave 5 of 5Bitcoin has hit the previous target and even breached lower. Now I believe the time has come to go long again with the stop just below recent low of around $98,500 and the take profit target as the old high of $112,000.
Good luck!

US Missiles Flyin'! Buy USD vs EUR GBP AUD NZD CAD CHF JPY!This is the FOREX futures outlook for the week of Jun 22-28th.
In this video, we will analyze the following FX markets:
USD Index, EUR, GBP, AUD, NZD, CAD, CHF, and JPY.
The USD is the world's reserve currency. When there are geo-political hot spots in the world, the USD sees inflows from investo

Multi-Timeframe Analysis & Trend Continuation TradingThe EURJPY has recently violated an important level of structure leading us to make the prediction of price continuing to go higher.
In this video we'll take a look at where the next stopping point may be and what I'm waiting for the market to do in order to get involved in the trade.
If you hav

$ETH: The 1-week chart is an absolute disaster!Once again, I want to make it clear: I’m naturally a bull. But I live in Thailand, far from the noise of influencers shouting "buy, buy, buy!" I’ve learned my lesson—when they scream buy, you get rekt. That’s why I rely solely on the charts.
Charts are just mathematics—they don’t lie. So here’s my

Tesla May Be StallingTesla bounced between early April and late May, but now it may be stalling.
The first pattern on today’s chart is the weekly low of $331.39 from May 22. TSLA fell below that level two weeks ago and was rejected at the same price area last week. Has old support become new resistance?
Second, the st

See all editors' picks ideas
Advanced Fed Decision Forecast Model (AFDFM)The Advanced Fed Decision Forecast Model (AFDFM) represents a novel quantitative framework for predicting Federal Reserve monetary policy decisions through multi-factor fundamental analysis. This model synthesizes established monetary policy rules with real-time economic indicators to generate proba

Timeframe LoopThe Timeframe Loop publication aims to visualize intrabar price progression in a new, different way.
🔶 CONCEPTS and USAGE
I got inspiration from the Pressure/Volume loop, which is used in Mechanical Ventilation with Critical Care patients to visualize pressure/volume evolution during inhal

Deviation Trend Profile [BigBeluga]🔵 OVERVIEW
A statistical trend analysis tool that combines moving average dynamics with standard deviation zones and trend-specific price distribution.
This is an experimental indicator designed for educational and learning purposes only.
🔵 CONCEPTS
Trend Detection via SMA Slope: Detect

Rolling Z-Score Trend [QuantAlgo]🟢 Overview
The Rolling Z-Score Trend measures how far the current price deviates from its rolling mean in terms of standard deviations. It transforms price data into standardized scores to identify overbought and oversold conditions while tracking momentum shifts.
The indicator displays a Z-S

Yelober - Sector Rotation Detector# Yelober - Sector Rotation Detector: User Guide
## Overview
The Yelober - Sector Rotation Detector is a TradingView indicator designed to track sector performance and identify market rotations in real-time. It monitors key sector ETFs, calculates performance metrics, and provides actionable stock

TASC 2025.07 Laguerre Filters█ OVERVIEW
This script implements the Laguerre filter and oscillator described by John F. Ehlers in the article "A Tool For Trend Trading, Laguerre Filters" from the July 2025 edition of TASC's Traders' Tips . The new Laguerre filter utilizes the UltimateSmoother filter in place of an exponenti

Trend Impulse Channels (Zeiierman)█ Overview
Trend Impulse Channels (Zeiierman) is a precision-engineered trend-following system that visualizes discrete trend progression using volatility-scaled step logic. It replaces traditional slope-based tracking with clearly defined “trend steps,” capturing directional momentum only when

Magnificent 7 OscillatorThe Magnificent 7 Oscillator is a sophisticated momentum-based technical indicator designed to analyze the collective performance of the seven largest technology companies in the U.S. stock market (Apple, Microsoft, Alphabet, Amazon, NVIDIA, Tesla, and Meta). This indicator incorporates established

SmartPhase Analyzer📝 SmartPhase Analyzer – Composite Market Regime Classifier
SmartPhase Analyzer is an adaptive regime classification tool that scores market conditions using a customizable set of statistical indicators. It blends multiple normalized metrics into a composite score, which is dynamically evaluated

ATR RopeATR Rope is inspired by DonovanWall's "Range Filter". It implements a similar concept of filtering out smaller market movements and adjusting only for larger moves. In addition, this indicator goes one step deeper by producing actionable zones to determine market state. (Trend vs. Consolidation)
>

See all indicators and strategies
News didn't load
Looks like that didn't go very well. Let's try again.
Community trends
Tesla Rolls Out Much-Awaited Robotaxis. Buy or Sell the Stock?They’re here. After years of tweets, teasers, and timelines that aged like unrefrigerated dairy, Tesla NASDAQ:TSLA officially launched its long-awaited robotaxi service in Austin, Texas.
The self-driving revolution, we were told, would arrive like a lightning bolt. Instead, it quietly rolled up
scalp short time 15M chart15min line is buy Take Profit is sell short period trade.
Wait for Strong Buyers to Step-in in the Green Zone:
We have two scenarios must happen at The Mentioned Zone:
Scenarios One: strong buying volume with reversal Candle.
Scenarios Two: Fake Break-Out of The Buying Zone.
Both indicate buyers

HIMS puked up its Wegovy today!Hims & Hers Health
HIMS
shares were down more than 34.63% in Monday trading, while Novo Nordisk
NVO stock was down over 5% after Novo Nordisk said it has halted its collaboration with Hims & Hers on the sale of weight loss drugs, including Wegovy.
The two companies launched a collaboration in A

$NVDA has topped, new lows incomingNVDA has now topped, you can see that we've just formed another high time frame lower high and the rejection up here has the potential to create a strong bearish move.
I think it's very likely that the bearish move will take us all the way down to the bottom support before it's completed.
The boun
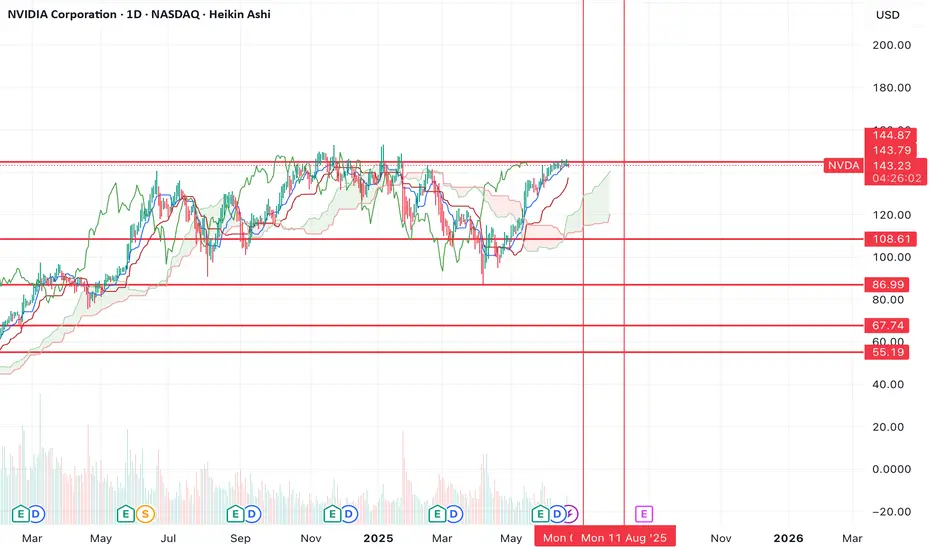
Nvidia - New all time highs!Nvidia - NASDAQ:NVDA - breaks out now:
(click chart above to see the in depth analysis👆🏻)
Within two and a half months, Nvidia rallied more than +70%. Following this recent bullish strength, a retest of the previous highs was totally expected. But this does not seem to be the end at all. There

Inverse head and shoulders complete The price has completed the formation of an inverse head and shoulders pattern and is preparing for an upward movement.
The price has already tested the neckline; the breakout above $132 will initiate the bullish trend

Beautiful textbook breakout by IONQIONQ has become quite the stock with a personality recently. Massive percentage swings from key level to key level occur regularly and fast. The stock seems to rush to its most logical target with no time to spare. I've personally been watching this stock very closely since the CEO hype breakout aft

6/23/25 - $fi - If you like $crcl u should like $fi more6/23/25 :: VROCKSTAR :: NYSE:FI
If you like NYSE:CRCL u should like NYSE:FI more
- all banks will have their own stable coins
- but for a player like FI what makes their launch so unique is that it can/ will likely be used for much more txn volume than any given bank based on their payments r

$NVDA 6/27 exp week; $150 calls. Quick ChartHello. Market is moving up off the “news” of “ceasefire” from Trump. Take what is given I suppose. NASDAQ:NVDA could see a beautiful upside towards the psych level of $150 in just one session (Tuesday, 6/24) which is just a “small” move of 3%. Could break out of its rising wedge. This name has bee

GOOGL at a Make-or-Break Zone! Will 165 Hold or Fold? Jun 24🔍 Market Structure:
GOOGL has been in a clear downtrend, printing multiple BOS (Break of Structure) on the 15-min and 1H charts. However, today we’ve seen a CHoCH (Change of Character) after price bounced from the key 162 zone. This signals a potential short-term reversal or at least a relief rally.

See all stocks ideas
Today
THCHTH International Limited
Actual
−0.25
USD
Estimate
−0.26
USD
Today
QMCOQuantum Corporation
Actual
—
Estimate
−1.17
USD
Today
IGCIGC Pharma, Inc.
Actual
—
Estimate
−0.02
USD
Today
MEIMethode Electronics, Inc.
Actual
—
Estimate
0.00
USD
Today
SNXTD SYNNEX Corporation
Actual
2.99
USD
Estimate
2.71
USD
Today
CCLCarnival Corporation
Actual
0.35
USD
Estimate
0.25
USD
Today
FDXFedEx Corporation
Actual
—
Estimate
5.82
USD
Today
ATEXAnterix Inc.
Actual
—
Estimate
−0.46
USD
See more events
News didn't load
Looks like that didn't go very well. Let's try again.
Community trends
Bitcoin - Drop to 98,922 then a big pump! (Buy here)Bitcoin is falling again mostly because of Trump's aggressive attack on Iran. But technical analysis in general is very strong, and we can find strong levels where smart money has their buy orders. You, as a fish, always want to trade with big whales. Bitcoin is approaching an extremely strong level

Bitcoin - Bounce Incoming or Breakdown to 97.5k?Market Context
Bitcoin recently swept the 100k lows, clearing out built-up liquidity beneath that level. This move formed a strong reaction candle, suggesting interest from buyers and confirming the presence of resting demand. The sweep aligns with the concept of smart money targeting obvious liqui

Altseason isn’t cancelled, it’s just delayed. Here's WHY!CRYPTOCAP:BTC Dominance Update:
Altseason isn’t cancelled, it’s just delayed.
The key zone to watch is 69.5%–73% dominance. That’s where we’re likely to see a strong rejection if it doesn't start soon, which seems unlikely given the current circumstances.
The longer it takes to reach that lev

Bitcoin Weekly Ultra-BearishThe 100K support is still valid but the weekly timeframe chart isn't looking good.
Good afternoon my fellow Cryptocurrency trader, how are you feeling today?
Bitcoin peaked the week 19-May. Then we have bearish action only.
The week after 19-May was red, then two neutral weeks and a continuation t

HelenP. I Bitcoin may break trend line and continue to move downHi folks today I'm prepared for you Bitcoin analytics. After testing the resistance area between 107500 and 108200 points, the price started to form a clear descending pattern, respecting the downward trend line with multiple touches. The price consistently failed to break above it, confirming beari

Bitcoin Completely Transformed Into a Bearish SetupBTC Completely Transformed Into a Bearish Setup
Since last week, BTC and most of the Alcoins have changed their direction from clearly rising to falling.
The reason why this happened is another topic, because it is never a clear reason, but it happens.
If the price is going to respect this falli

Lingrid | BTCUSDT potential Bullish Momentum after Fake BreakoutBINANCE:BTCUSDT just reclaimed the support area after a deep liquidity grab below 100,000, rebounding sharply toward the mid-range. Price is still trapped below the descending resistance trendline, but the recent fake break and reversal signal a bullish shift in momentum. If bulls hold above 100K,

Bitcoin can correct to support line of channel and start to growHello traders, I want share with you my opinion about Bitcoin. The price was moving inside a strong upward channel, where it managed to break through the support level and then the resistance level, eventually reaching the seller zone. After that, BTC started to turn around and declined, once again

BTCUSDT – Rebound from trendline, targeting 115,300On the daily chart, BTCUSDT has bounced from a confluence support zone around 105,200, where the rising trendline meets the FVG, confirming that the bullish structure remains intact. The current price pattern suggests a continuation of the uptrend, with a short-term target at the 115,300 resistance

Bitcoin Breakout Incoming? Flash PMI & CME Gap in FocusBitcoin ( BINANCE:BTCUSDT ) started to fall ( about -4%) after the news that the US was involved in the Middle East tension , but it has risen again with good momentum .
Do you think Bitcoin will go below the previous bottom($98,200) again on the 1-hour time frame?
Bitcoin is trading in

See all crypto ideas
News didn't load
Looks like that didn't go very well. Let's try again.
GOLD → Risk zone 3340. Sell-off after rallyFX:XAUUSD , after breaking out of its accumulation phase, rallied towards the 3400 zone of interest, but failed to reach liquidity and reversed, selling off its gains due to economic uncertainty.
In my opinion, the market is unexpectedly subdued and has reacted very weakly to geopolitical prob

HelenP. I Gold may continue to decline to support levelHi folks today I'm prepared for you Gold analytics. After dropping from the support zone, the price of Gold found temporary support near the trend line and started to rise again. The upward movement was sharp and even created a gap while breaking through the previous support level, which then acted

THE KOG REPORT - Update End of day update from us here at KOG:
Following on from the KOG report, we said there was a huge caveat to the idea, that being that we will tap into that red box resistance and then make the drop rather than just continuing upside. This move worked out well not only giving the RIP but also termi

Gold Take All Stop losses,Are You Ready To Sell To Get 300 Pips?Here is my 1H Gold Chart and this is my opinion , the price opened this week with massive wick to upside to take all stop losses and then moved to downside very hard and aggressive , we have a very good Res that we sell from it last week 3377.00 , it`s still strong and forced the price many times t

Gold XAU/USD Bullish Reversal Setup – Targeting $3,454.65Price: $3,384.41
Strategy: Buy/Long
🟦 Key Levels:
Entry Zone: Around $3,345.76
This level aligns with a previously tested support zone marked in purple.
Stop Loss: $3,331.56
Below the support zone, providing downside protection if the setup fails.
Target (TP): $3,454.65
Marked as EA TARGET POINT

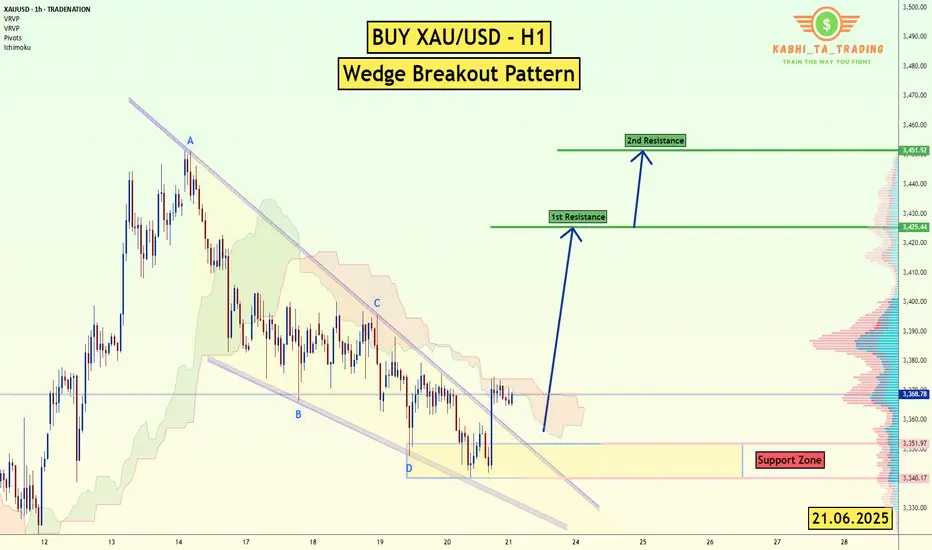
XAU/USD (Gold) - H1 - Wedge Breakout (21.06.2025)The XAU/USD pair on the H1 timeframe presents a Potential Buying Opportunity due to a recent Formation of a Wedge Breakout Pattern. This suggests a shift in momentum towards the upside and a higher likelihood of further advances in the coming Days.
Possible Long Trade:
Entry: Consider Entering A
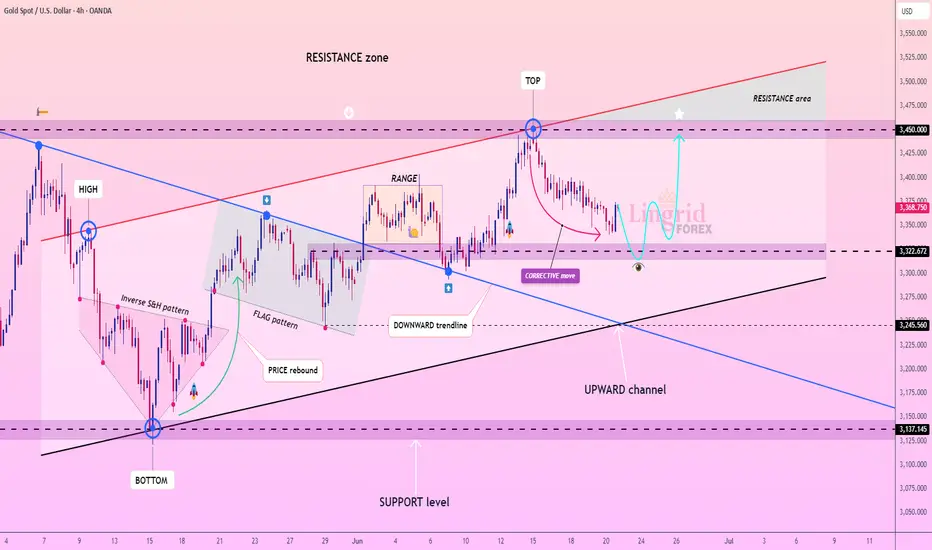
Lingrid | GOLD Weekly Outlook: Corrective Phase Tests SupportOANDA:XAUUSD experienced a notable pullback this week, retreating from the $3,450 resistance zone as profit-taking emerged following the recent geopolitical rally. The market appears to be entering a healthy corrective phase after the strong upward momentum driven by Middle Eastern tensions and saf
GOLD - Price can rise in channel to $3495 resistance lineHi guys, this is my overview for XAUUSD, feel free to check it and write your feedback in comments👊
After price started to trades inside triangle, it made an impulse up, breaking two levels, after which turned around.
Price dropped to $3195 level, breaking resistance level, and made a first gap, a

GOLD ROUTE MAP UPDATEHey Everyone,
Great start to the week with our new 1H chart playing out to perfection!!!
We started with a gap on market open clearing our Bullish target. We then got our bearish target at 3348, followed with no ema5 cross and lock confirming the rejection into our bullish target 3376.
We now ha

Gold Holding Strong – Eyes on $3400 and Beyond! (READ)By analyzing the gold chart on the 4-hour timeframe, we can see that after our last analysis, the price corrected down to $3341, then rallied back up to $3399. Currently, gold is trading around $3373, and if it manages to hold above $3355, we can expect further upside movement.
Potential bullish ta

See all futures ideas
News didn't load
Looks like that didn't go very well. Let's try again.
#GBPUSD: Bulls are in control, DXY Dropping Sharply!Hello Team,
We have identified a promising opportunity with a favourable price movement. The Pound Sterling to US Dollar (GBPUSD) pair has exhibited strong bullish volume, indicating potential further appreciation.
The current geopolitical tensions, particularly the involvement of the United State

EURCAD at key resistance: Will price rebound to 1.5215?The price is currently at a strong resistance level, where it has struggled to break through and reversed sharply to the downside before. This makes the area particularly important to monitor, especially for traders considering potential short setups.
If we begin to see signs of rejection at this

NZD/JPY - Triangle Breakout (23.06.2025)The NZD/JPY Pair on the H1 timeframe presents a Potential Selling Opportunity due to a recent Formation of a Triangle Breakout Pattern. This suggests a shift in momentum towards the downside in the coming hours.
Possible Short Trade:
Entry: Consider Entering A Short Position around Trendline O

USD/JPY Bullish Reversal Trade Setup – Key Support Test at 145.2Entry Point: 145.273 (highlighted in blue)
Stop Loss: ~144.817–145.260 (purple zone)
Target Point (TP): 148.133 (upper resistance zone)
📉 Recent Price Action:
Price peaked near 148.05 before reversing sharply and breaking the trendline.
The market is currently testing the support zone (near the

GBPUSD Breakout and Potential RetraceHey Traders, in today's trading session we are monitoring GBPUSD for a buying opportunity around 1.35900 zone, GBPUSD was trading in a downtrend and successfully managed to break it out. Currently is in a correction phase in which it is approaching the retrace area at 1.35900 support and resistance

EURUSD I Monthly CLS I KL -MOB I Model 1Hey, Market Warriors, here is another outlook on this instrument
If you’ve been following me, you already know every setup you see is built around a CLS Footprint, a Key Level, Liquidity and a specific execution model.
If you haven't followed me yet, start now.
My trading system is completely

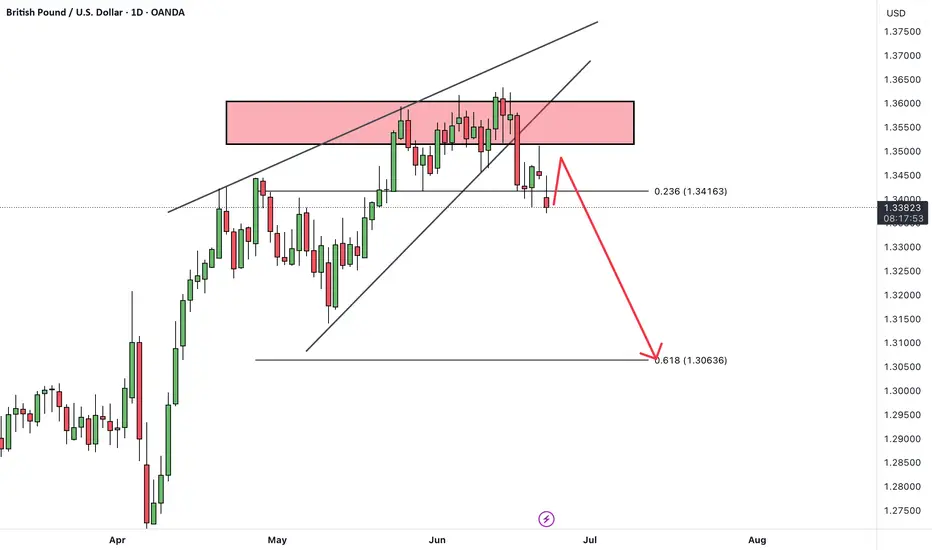
GBPUSDHello Traders! 👋
What are your thoughts on GBPUSD?
On the GBPUSD chart, we can see that the price has repeatedly tested a key resistance zone but failed to break above it, resulting in multiple rejections.
After forming a rising wedge pattern, the pair has broken down below the wedge, and is now c
GBPAUD XABCD Short from PRZ/D TP1/TP2 Swing Trade🔸Hello traders, let's review the 20 MINUTE chart for GBPAUD. Strong gains off the lows recently, however price getting overextended and expecting reversal later at/near PRZ/D.
🔸Speculative XABCD structure defined by point X 1000 point A 0700 point B 0930 point C 0640 point D/PRZ 1080 still pending.

Lingrid | EURUSD Pullback - Awaiting Trend Continuation SignalFX:EURUSD is consolidating above the upward trendline after forming a triangle within the broader ascending channel. The recent pullback tested the 1.1444 support zone, with a rebound hinting at renewed bullish pressure. A push beyond 1.1620 could unlock upside toward the 1.1700 resistance mark.
📈

NZDCHF Analysis – “Kiwi Faces Uphill Battle Against Safe-Haven FNZDCHF Price has formed a bearish pennant / triangle after a strong drop from the highs around 0.4960.
Rejection seen from the trendline resistance at ~0.4900, suggesting limited bullish momentum.
Bearish targets are mapped to:
0.4847 (first support)
0.4819 (deeper bearish target)
Two bearish s

See all forex ideas
| - | - | - | - | - | - | - | ||
| - | - | - | - | - | - | - | ||
| - | - | - | - | - | - | - | ||
| - | - | - | - | - | - | - | ||
| - | - | - | - | - | - | - | ||
| - | - | - | - | - | - | - | ||
| - | - | - | - | - | - | - | ||
| - | - | - | - | - | - | - |
News didn't load
Looks like that didn't go very well. Let's try again.
Trade directly on the supercharts through our supported, fully-verified and user-reviewed brokers.


