EUR/USD: Euro Pops Above $1.16 in Four-Year High. What’s Next?The dollar wobbles, Trump talks tariffs, and the euro’s got its dancing shoes on.
The Euro Wakes Up, Stretching Its Legs at $1.16
Look who just rolled out of bed and decided to make a scene.
For the first time in four years, the euro has finally leapt out of its slumber and sprinted to $1.16 —

The best trades require research, then commitment.
Get started for free$0 forever, no credit card needed

Scott "Kidd" PoteetThe unlikely astronaut

Where the world does markets
Join 100 million traders and investors taking the future into their own hands.

ETHEREUM: THE NEW BOND OF THE DIGITAL WORLDPrice isn’t the goal. Price is the side effect.
Meanwhile, BlackRock - a black hole with a trust-backed logo - just absorbed 42,000 ETH more.
Yesterday, you may have read this "regular" headline:
BlackRock increases its Ethereum exposure to $4 billion, adding $109.5 million via ETFs.
But here’s w

Silver surge has more bullish upsideSilver is breaking out. Its strength is no accident. The US is running a structural deficit north of 6% of GDP in a full-employment economy. The bond market has absorbed the pain so far, but pressure is building. Investors are starting to look for insurance. Silver is one of the cleanest ways to pl

Soaring platinum breaks a 3 year high at $1,152.50/ozChina, the world’s largest consumer of platinum, imported its highest amount in a year last month. Retail investment demand (bars and coins) in China more than doubled, overtaking North America as the top market for platinum investment.
Analysts at Bloomberg Intelligence predict that global platinum

Elon Musk vs Trump: Who you betting on?Elon Musk and Donald Trump have recently had a public falling-out, with their feud playing out on social media and in political circles.
The dispute seems to have started over Trump's new budget bill, which Musk has criticized for increasing the national debt. Trump, in turn, accused Musk of being

OptionsMastery: Inverse head and shoulders on UAL! 🔉Sound on!🔉
📣Make sure to watch fullscreen!📣
Thank you as always for watching my videos. I hope that you learned something very educational! Please feel free to like, share, and comment on this post. Remember only risk what you are willing to lose. Trading is very risky but it can change your life!

The MSCI World index sets a new all-time record!The MSCI World stock market index set a new all-time record during the trading session of Monday June 2, wiping out the entire stock market shock of February/March, which saw the global equity market lose 20%. This technical signal still needs to be confirmed at the end of the week at the next weekl

USDJPY forms textbook head and shoulders patternOur last bearish call on USDJPY played out perfectly. Now, a new setup is forming. With US ISM data showing contraction and stock markets under pressure, the dollar-yen could be next to drop. Watch as we break down the textbook head and shoulders pattern and the levels to watch for a potential 600+

Do bulls have enough steam to drive gold higher?A lot of things to consider this week, a lot of data and geopolitical tensions. Will the economic uncertainty and potential bad US jobs data drive TVC:GOLD higher? Let's dig in.
FX_IDC:XAUUSD
Let us know what you think in the comments below.
Thank you.
77.3% of retail investor accounts lose

Bull market scenario LITECOINAt this period, I'm speaking about LITECOIN, which currently has one of the strongest bull-looking charts on cryptocurrency!
We may see the price testing Fibo's higher levels very soon...
A bull market may begin, so I recommend focusing on higher price markings...
On another market, like BTC, Ethe

See all editors' picks ideas
ATR RopeATR Rope is inspired by DonovanWall's "Range Filter". It implements a similar concept of filtering out smaller market movements and adjusting only for larger moves. In addition, this indicator goes one step deeper by producing actionable zones to determine market state. (Trend vs. Consolidation)
>

Langlands-Operadic Möbius Vortex (LOMV)Langlands-Operadic Möbius Vortex (LOMV)
Where Pure Mathematics Meets Market Reality
A Revolutionary Synthesis of Number Theory, Category Theory, and Market Dynamics
🎓 THEORETICAL FOUNDATION
The Langlands-Operadic Möbius Vortex represents a groundbreaking fusion of three profound mathematic

Risk-Adjusted Momentum Oscillator# Risk-Adjusted Momentum Oscillator (RAMO): Momentum Analysis with Integrated Risk Assessment
## 1. Introduction
Momentum indicators have been fundamental tools in technical analysis since the pioneering work of Wilder (1978) and continue to play crucial roles in systematic trading strategies (Jeg

TrendMaster Pro 2.3 with Alerts
Hello friends,
A member of the community approached me and asked me how to write an indicator that would achieve a particular set of goals involving comprehensive trend analysis, risk management, and session-based trading controls. Here is one example method of how to create such a system:
Core

Support and Resistance Logistic Regression | Flux Charts💎 GENERAL OVERVIEW
Introducing our new Logistic Regression Support / Resistance indicator! This tool leverages advanced statistical modeling "Logistic Regressions" to identify and project key price levels where the market is likely to find support or resistance. For more information about the proc

Mandelbrot-Fibonacci Cascade Vortex (MFCV)Mandelbrot-Fibonacci Cascade Vortex (MFCV) - Where Chaos Theory Meets Sacred Geometry
A Revolutionary Synthesis of Fractal Mathematics and Golden Ratio Dynamics
What began as an exploration into Benoit Mandelbrot's fractal market hypothesis and the mysterious appearance of Fibonacci sequences i

EMD Trend [InvestorUnknown]EMD Trend is a dynamic trend-following indicator that utilizes Exponential Moving Deviation (EMD) to build adaptive channels around a selected moving average. Designed for traders who value responsive trend signals with built-in volatility sensitivity, this tool highlights directional bias, market

Bear Market Probability Model# Bear Market Probability Model: A Multi-Factor Risk Assessment Framework
The Bear Market Probability Model represents a comprehensive quantitative framework for assessing systemic market risk through the integration of 13 distinct risk factors across four analytical categories: macroeconomic indic

Range Filter [DW]This is an experimental study designed to filter out minor price action for a clearer view of trends.
Inspired by the QQE's volatility filter, this filter applies the process directly to price rather than to a smoothed RSI.
First, a smooth average price range is calculated for the basis of the fil

Delta Volume Columns Pro [LucF]█ OVERVIEW
This indicator displays volume delta information calculated with intrabar inspection on historical bars, and feed updates when running in realtime. It is designed to run in a pane and can display either stacked buy/sell volume columns or a signal line which can be calculated and dis

See all indicators and strategies
News didn't load
Looks like that didn't go very well. Let's try again.
Community trends
GAME CRACK!GAME is one of the easiest stocks to short.
Just wait for the bearish signal and take the trade. Over and over and over again.
Anyone who wishes to learn what Bull Traps are should study GME chart.

UNH Weekly Options Setup – Short-Term Pullback Risk (2025-06-11)📉 UNH Weekly Options Setup – Short-Term Pullback Risk (2025-06-11)
Ticker: NYSE:UNH (UnitedHealth Group)
Bias: Short-Term Bearish
Setup Timing: Market Open | Confidence: 70%
🔍 AI Model Consensus Overview
📍 Price: ~$310.56
📈 Momentum: Strong intraday bullish momentum — price above 10, 50, and 200

Inverted H & SLeft Shoulder: Formed in late February.
Head: Created in March at the lowest point.
Right Shoulder: Recently completed in early June.
Neckline Breakout: The price is now testing or breaking above the neckline (~$15), which is typically a bullish breakout signal.

Ascending TriangleLook for upcoming breakout to the upside. If you know how to calculate the breakout than I don’t need to explain it.

AMAT on WatchLooking for a break above $176.50 and retest before entering.
Why:
Broke out of long term channel
Made a strong recovery after shakeout on May 30th
Above all major EMAs on daily and weekly

SNAP - Snapped Back Into ActionSNAP recaptured a key historical level a confirmed it's validity with back test and local higher lows. Targeting 10, 12, & possibly 17 / gap fill at 14.

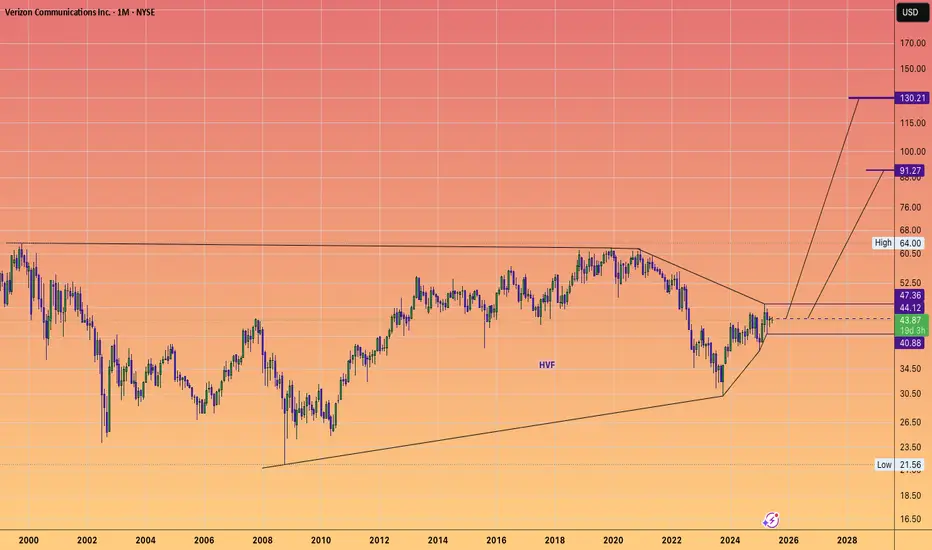
VERIZON will run up to $130It's not me
it's the chart that says it will
#HVF
#HuntVolatiltyFunnel
@FrancisHunt-TheMarketSnipe
@TheMarketSniper
@TheCryptoSniper
Intel (INTC) Shares Drop Over 6% in a DayIntel (INTC) Shares Drop Over 6% in a Day
As shown on the Intel (INTC) chart, after Tuesday’s candle closed above $21, the price dropped sharply on Wednesday. INTC was the worst-performing stock of the day among the components of the S&P 500 index (US SPX 500 mini on FXOpen).
Why Did INTC Shares

The AMD Long Heist – Ready to Rob the Bulls?!🕵️♂️💼“Operation: AMD Vault Breach”💼🕵️♂️
(A Bold Heist by the Thief Traders Guild – Long Entry Blueprint)
🌟Hi! Hola! Ola! Bonjour! Hallo! Marhaba!🌟
Dear Money Makers & Robbers, 🤑💰💸✈️
Based on our 🔥Thief Trading style technical & fundamental analysis🔥, we’ve crafted the master blueprint to heist t

VISA - A Pump & Dump? Help me understand please.To places where no stock price has ever gone before..
What makes VISA so special?
The credit industry is currently staring into the abyss due to massively rising payment defaults.
Why is VISA skyrocketing in price, breaking through every barrier as if they were made of butter?
I don't know, and I

See all stocks ideas
Today
PODCPodcastOne, Inc.
Actual
—
Estimate
−0.04
USD
Today
MNYMoneyHero Limited
Actual
—
Estimate
—
Jun 16
AIOTPowerFleet, Inc.
Actual
—
Estimate
−0.02
USD
Jun 16
CODACoda Octopus Group, Inc.
Actual
—
Estimate
0.03
USD
Jun 16
LENLennar Corporation
Actual
—
Estimate
1.94
USD
Jun 16
RFILRF Industries, Ltd.
Actual
—
Estimate
0.04
USD
Jun 16
APPSDigital Turbine, Inc.
Actual
—
Estimate
0.04
USD
Jun 16
GLBSGlobus Maritime Limited
Actual
—
Estimate
−0.09
USD
See more events
News didn't load
Looks like that didn't go very well. Let's try again.
Community trends
Bitcoin At Resistance: OMG! Not Another 20X SHORT!Sell at resistance; buy at support.
Good morning my fellow Cryptocurrency trader, I hope you are having a wonderful day.
Being able to adapt to changing market conditions is one of the signs of being a great trader. Being able to spot changes on a chart is also indicative of someone that can produ

ETHEREUM: THE NEW BOND OF THE DIGITAL WORLDPrice isn’t the goal. Price is the side effect.
Meanwhile, BlackRock - a black hole with a trust-backed logo - just absorbed 42,000 ETH more.
Yesterday, you may have read this "regular" headline:
BlackRock increases its Ethereum exposure to $4 billion, adding $109.5 million via ETFs.
But here’s w
Bitcoin long $600k- long Bitcoin targeting $10-12T market cap by 2028
- acceleration of companies accumulating Bitcoin + continuation of Saylor & Strategy's ongoing TWAP
- notable uptick in global concerns w/ having access to non-sovereign store of wealth not affected by government intervention + over-reliance on USD

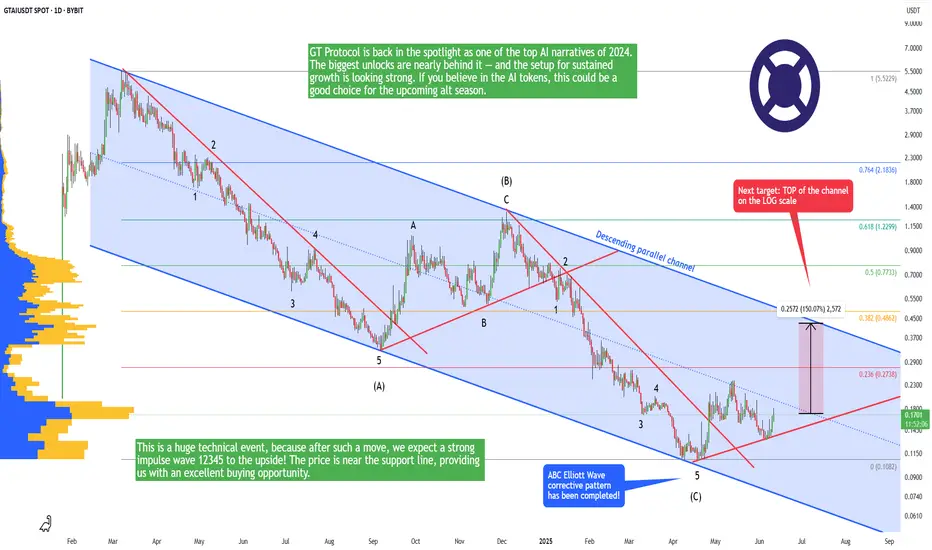
GTAI - Time to buy this altcoin! (bottom is in)GTAI (GT Protocol) is a relatively new altcoin that is listed on major exchanges. On CoinMarketCap, this altcoin has a rank of #1121, which means it has a lot of room to go to the upside. You probably don't want to buy some famous altcoins in the TOP section because there is no 100x potential anymor
Trading Recommendations for the BTC/USDU.S. Treasury Secretary Scott Bessent stated yesterday that USD-backed stable coins could reach a market capitalization of $2 trillion or more. His remarks indicate growing governmental interest in cryptocurrencies, particularly stable coins, as a potentially vital component of the future financial

BTC/USD.1h chart patternBTC/USD 1-hour chart, we can see that MY continuing a bearish price projection, and the chart has clearly defined target zones based on structure and Ichimoku analysis.
🔍 Key Observations:
Price is currently below the Ichimoku cloud, confirming a bearish bias.
A resistance retest has already occu

Altcoin dominance about to explode!This chart looks BULLISH as hell!
My guess is that the inverse Bitcoin dominance will explode higher.
The question is how high? I think Altcoin dominance could go to 70% .
Past altcoin cycles always went above the last peak.
We need to beat 65%.

BITCOIN Megaphone is the last step before $150k.Bitcoin (BTCUSD) is repeating almost to the exact point the 2023/ 2024 uptrend, as right now it is in the process of forming a Megaphone pattern similar to the one during December 2023 - January 2024.
Before that, both patterns started the uptrend when a 1D Death Cross formed the bottom. After the

ETH/USD LONG SETUPThe chart displays the Ethereum/U.S. Dollar (ETHUSD) price action on a 1-day timeframe. The price has broken through a descending channel, indicating a potential buying opportunity. A blue rectangle highlights a support zone, and a blue shaded area projects a potential price increase. The current pr

BTCUSDEventually anything goes up sooner or later goes down especially speculative and high liquidity market this is the system or core process and nothing is impossible.
Again, it's just simple prediction based on simple technical analysis there are so many other factors involve where to market would b

See all crypto ideas
News didn't load
Looks like that didn't go very well. Let's try again.
Lingrid | GOLD Consolidation ZONE: Possible SHORT SetupOANDA:XAUUSD has formed multiple lower highs near the 3376–3380 zone, consistently rejecting the descending red trendline within the resistance area. Despite a strong rebound from the May low, price is now testing the underside of this multi-touch resistance and stalling just under 3376. A rejecti

GOLD → Strengthening and return to range. Focus on 3340FX:XAUUSD is forming a fairly strong support zone (a cascade within an upward line). The price is returning to the range, with bulls storming 3330-3340.
Markets are awaiting US inflation data (CPI), which may affect expectations for a Fed rate cut in September (chances are about 52%). Optimism

GOLD ROUTE MAP UPDATEHey Everyone,
Another PITASTIC day on the charts, with our analysis playing out perfectly.
Yesterday after completing the target at 3352, we stated that we’ll be watching for a confirmed cross and lock above 3352 for a continuation. We got the cross and lock above 3352 opening 3388.
- 3388 was h

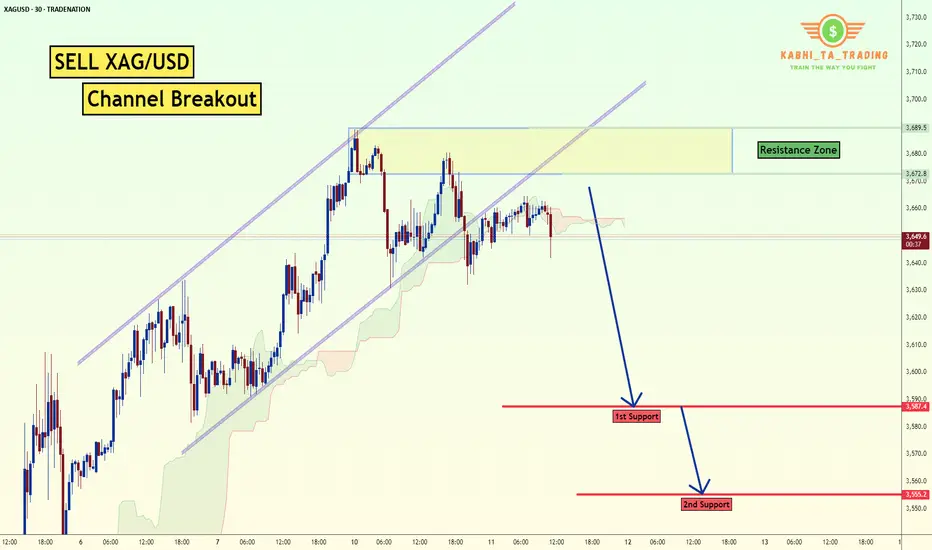
XAG/USD - Channel Breakout (11.06.2025) The XAG/USD Pair on the M30 timeframe presents a Potential Selling Opportunity due to a recent Formation of a CHannel Breakout Pattern. This suggests a shift in momentum towards the downside in the coming hours.
Possible Short Trade:
Entry: Consider Entering A Short Position around Trendline O
Gold Correction = Bearish Divergence + Wedge + Zigzag CompleteGold ( OANDA:XAUUSD ) attacked the Resistance zone($3,387-$3,357) today after the release of the US CPI indices . Although the figures seemed to be in gold's favor, traders still seem to be determined to continue the price correction.
In terms of Elliott Wave theory , it seems that Gold h

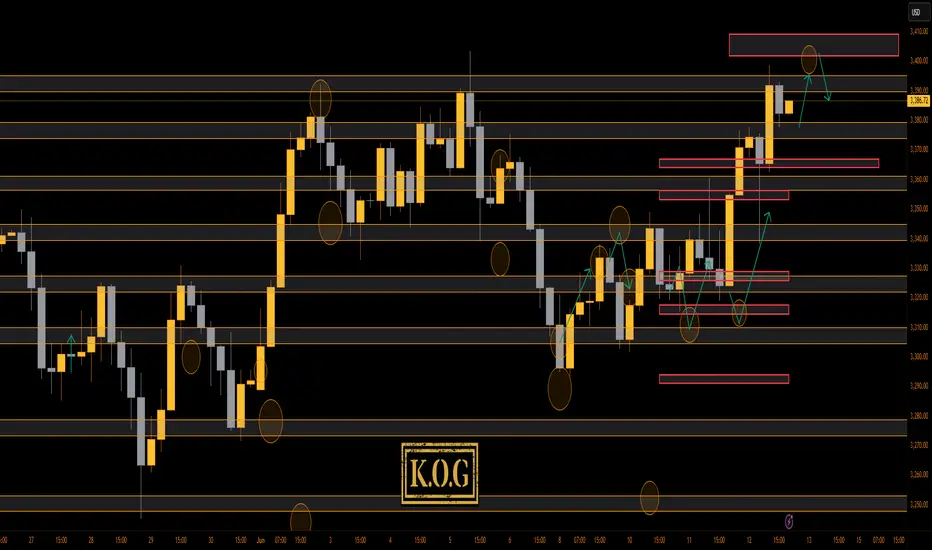
THE KOG REPORT - Update End of day update from us here at KOG:
Yesterday we wanted a swoop below to then attempt the long, we didn't get the exact level but anyone who got in will have hit not only the target shared in the report but also a majority of the red box and KOG's bias level targets for the week and day.
We now
TOP 10 Stats of the Current Gold Bull Market in 2025 and Outlook📊 Top 10 Stats of the Current Gold Bull Market (2025)
1. 🥇 Gold price per ounce: Around $3,338–$3,364, with a recent all-time high above $3,500 in April 2025
2. 📈 Year-to-date gain: About +29% in 2025 so far, after a +30% gain in 2024
3. 🏦 Central bank buying: More than 1,000 tonnes bought for the f

XAU/USD.4h chart pattern.Gold (XAU) buy trade setup:
Trade Setup
Direction: Buy
Entry: 3386
1st Target: 3435
2nd Target: 3500
Stop Loss: Not provided (highly recommended to define this)
Potential Profit
To 1st Target: 3435 - 3386 = 490 points
To 2nd Target: 3500 - 3386 = 1140 points
Recommendation
🔺 Without a stop l

Gold (XAUUSD) Eyes 3,330 Zone as Safe-Haven Demand Builds!!Hey Traders, In today’s trading session, we’re keeping a close watch on XAUUSD for a potential buying opportunity around the 3,330 zone. Gold continues to trade within a strong uptrend, and is currently undergoing a healthy correction, bringing it near a key support/resistance level that could act a

Crude Oil Going Higher - TA and fundamentals aligneThe 0-5 count is not over yet.
Sudo 4 and 5 are still lurking.
It's good to see how the Medianline-Set cought the Highs of the swings. Likewise we can see the subborn rejection at the Center-Line at P3.
I will not trade CL to the short side, until it's clear that P4 is engraved in this Chart. Unti

See all futures ideas
News didn't load
Looks like that didn't go very well. Let's try again.
GBP/JPY - Triangle Breakout (12.06.2025)The GBP/JPY Pair on the M30 timeframe presents a Potential Selling Opportunity due to a recent Formation of a Triangle Breakout Pattern. This suggests a shift in momentum towards the downside in the coming hours.
Possible Short Trade:
Entry: Consider Entering A Short Position around Trendline

EURUSD Setup | CPI Fades, Fed Focus & Gold Leads Dollar ReboundEURUSD is showing signs of exhaustion after soft US CPI failed to extend the rally beyond 1.1495. While markets initially priced in a dovish Fed response, recent commentary and gold’s rejection from its highs suggest the dollar may be gearing up for a short-term recovery. With Gold pulling back and

EUR/USD: Euro Pops Above $1.16 in Four-Year High. What’s Next?The dollar wobbles, Trump talks tariffs, and the euro’s got its dancing shoes on.
The Euro Wakes Up, Stretching Its Legs at $1.16
Look who just rolled out of bed and decided to make a scene.
For the first time in four years, the euro has finally leapt out of its slumber and sprinted to $1.16 —
EURUSD - Waiting for the Breakdown After 4H SweepEURUSD has just completed a sweep of the 4H highs, tagging liquidity resting above the consolidation range. That move looks like a classic inducement, with price now reacting lower and showing signs of weakness. This type of sweep, especially when it happens inside a range, often leads to a reversal

NZDCHF Bearish Setup: ABCDE Pattern CompletedNZDCHF Bearish Setup: ABCDE Pattern Completed
NZDCHF has completed an ABCDE pattern and is showing signs of a potential bearish movement.
The pair may decline further from the current market price, or it could make a brief correction before moving downward, as indicated on the chart.
The previo

EUR/GBP 4H Bullish Breakout Trade Setup – Demand Zone to 0.85250📉 Trendline Break
🔵 A key trendline was broken 🔽 (bearish ➡️ bullish shift).
✂️ This break signals potential upside movement as sellers lose control.
🟦 Demand Zone (BUY Area)
📍 Zone: 0.83967 – 0.84249
🛒 Buyers expected here!
🟢 Price may pull back here before heading up.
🟡 This is marked as the EN

CAD_CHF STRONG SUPPORT AHEAD|LONG|
✅CAD_CHF will be retesting a support
Level soon around 0.5920
From where I am expecting a bullish reaction
With the price going up but we need
To wait for a reversal pattern to form
Before entering the trade, so that we
Get a higher success probability of the trade
LONG🚀
✅Like and subscribe

Lingrid | GBPJPY potential Extension after Bullish BreakoutOANDA:GBPJPY is consolidating just above the key support around 195.05 after bouncing from a higher low and failing to hold the recent breakout above PMH. The bullish structure remains intact within the upward channel, but the pair is currently lacking momentum. If price holds above 195.00 and form

EURUSD - Getting Over-Bought?Hello TradingView Family / Fellow Traders. This is Richard, also known as theSignalyst.
📈EURUSD has been overall bullish trading within the rising channels marked in red and blue. However, it is currently retesting the upper bound of the channels.
Moreover, the orange zone is a major daily high.

EURUSD follow the ascending channel selling now from bearish obEURUSD – Bearish Setup in Play! 🚨
4H Timeframe Analysis
EURUSD has been respecting the ascending channel, but price just tapped a key supply zone at 1.15700 and showed strong rejection. This signals a potential sell-off from current levels. 📉
🔻 Technical Targets:
📍 1st TP: 1.14200
📍 2nd TP: 1.127

See all forex ideas
| EUR | USD | GBP | JPY | CHF | CAD | |||
|---|---|---|---|---|---|---|---|---|
| EUR | - | - | - | - | - | - | - | |
| USD | - | - | - | - | - | - | - | |
| GBP | - | - | - | - | - | - | - | |
| JPY | - | - | - | - | - | - | - | |
| CHF | - | - | - | - | - | - | - | |
| AUD | - | - | - | - | - | - | - | |
| CNY | - | - | - | - | - | - | - | |
| CAD | - | - | - | - | - | - | - |
News didn't load
Looks like that didn't go very well. Let's try again.
Trade directly on the supercharts through our supported, fully-verified and user-reviewed brokers.


