MRVL | Ichimoku Breakout Setup with Fractal and MACDMarvell Technology (MRVL) just printed a clean bullish breakout setup across multiple technical systems. Here's the breakdown:
Why This Setup Matters
Ichimoku Cloud: Price has decisively cleared the cloud with bullish Tenkan-Kijun alignment. The Senkou Span A is rising, and the cloud ahead is thin

The best trades require research, then commitment.
Get started for free$0 forever, no credit card needed

Scott "Kidd" PoteetThe unlikely astronaut

Where the world does markets
Join 100 million traders and investors taking the future into their own hands.

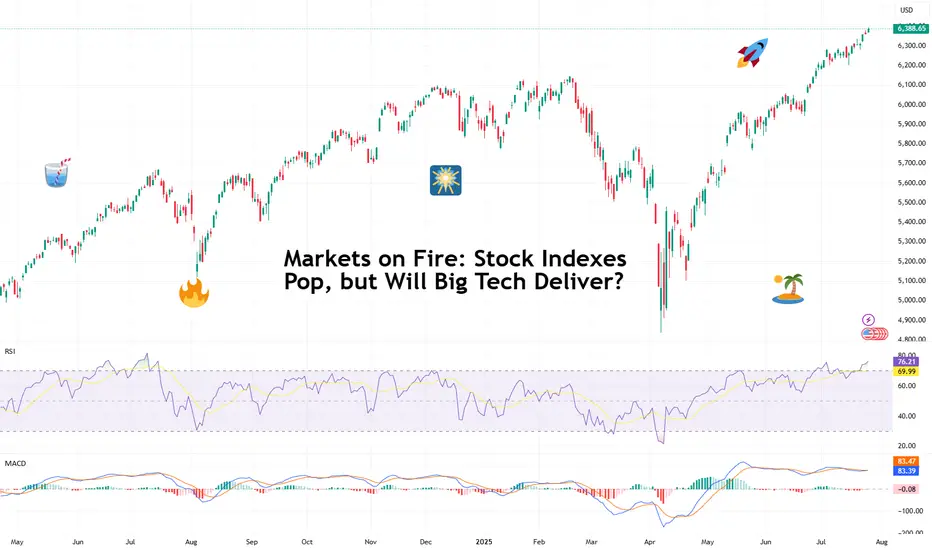
Markets on Fire: Stock Indexes Pop, but Will Big Tech Deliver?S&P 500 and Nasdaq set records. Now it's up to big tech to justify that.
Talk about forward-looking valuation. Tech companies’ valuations are largely based on future potential rather than current performance. And that’s what we’re seeing right now getting priced in across the big indexes.
You’d
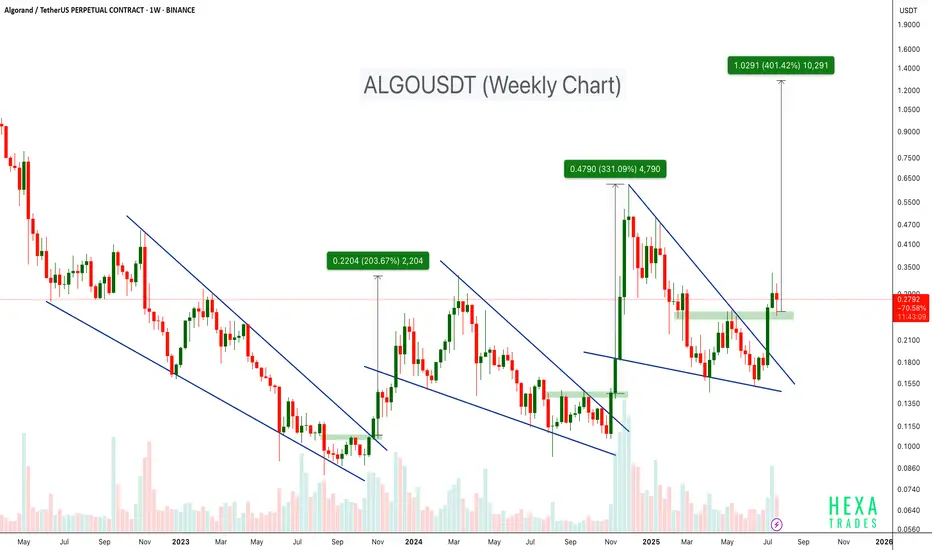
ALGO Breaks Out of Falling Wedge – 400% Target Ahead?BINANCE:ALGOUSDT has consistently followed a bullish pattern on the weekly timeframe. Each major rally has been preceded by a falling wedge breakout, as shown by the three highlighted instances on the chart.
- First breakout: ~200%+ move
- Second breakout: ~300%+ move
- Current breakout projection
Retro Editors' picks 2021Going further in our retro EP selection , we present to you a collection of additional scripts from 2021 that have earned a spot in our Editors' picks. These retrospective selections reflect our continued commitment to honoring outstanding contributions in our community, regardless of when they wer

Retro Editors' picks 2022Going further in our retro EP selection , we present to you the third collection of additional scripts that have earned a spot in our Editors' picks, now from 2022.
These retrospective selections reflect our continued commitment to honoring outstanding contributions in our community, regardless o
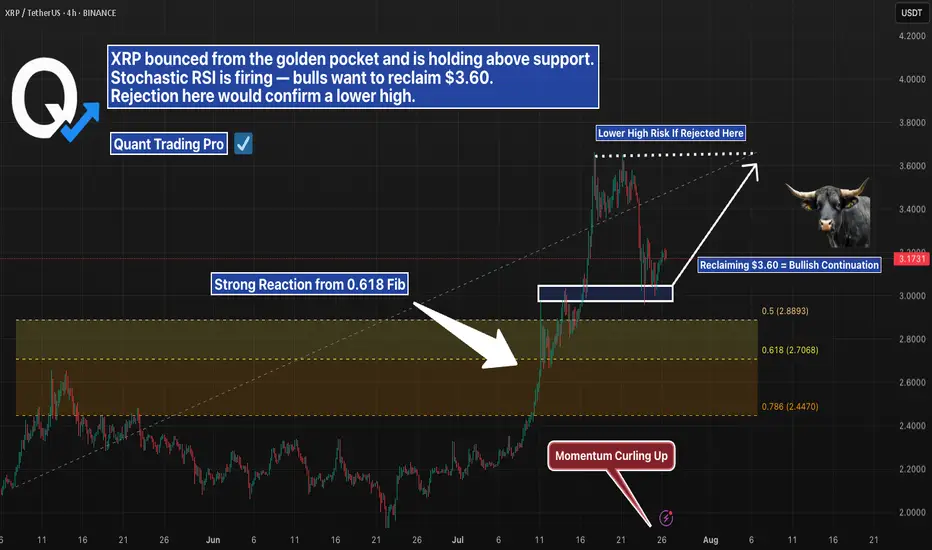
XRP 4H – Golden Pocket Bounce, But Will Bulls Reclaim $3.60?XRP pulled back cleanly into the golden pocket (0.618 Fib) after a strong rally — and buyers stepped in with force. Momentum flipped quickly, and Stochastic RSI is curling up with bullish intent.
Now price is holding above short-term support, but faces a key challenge:
→ $3.60 marks the prior high
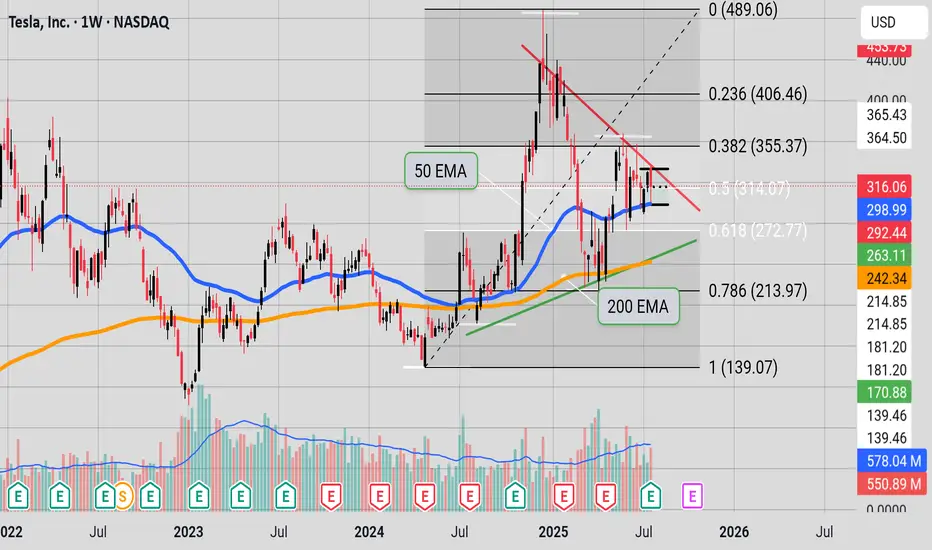
Inflection point"Tesla is at a binary point on the chart. The stock is wedged tightly between the red, downward-sloping resistance line (upper boundary) and the green, upward-sloping support line (lower boundary)—the classic apex of an asymmetrical triangle.
At this stage:
A breakout above the red resistance woul
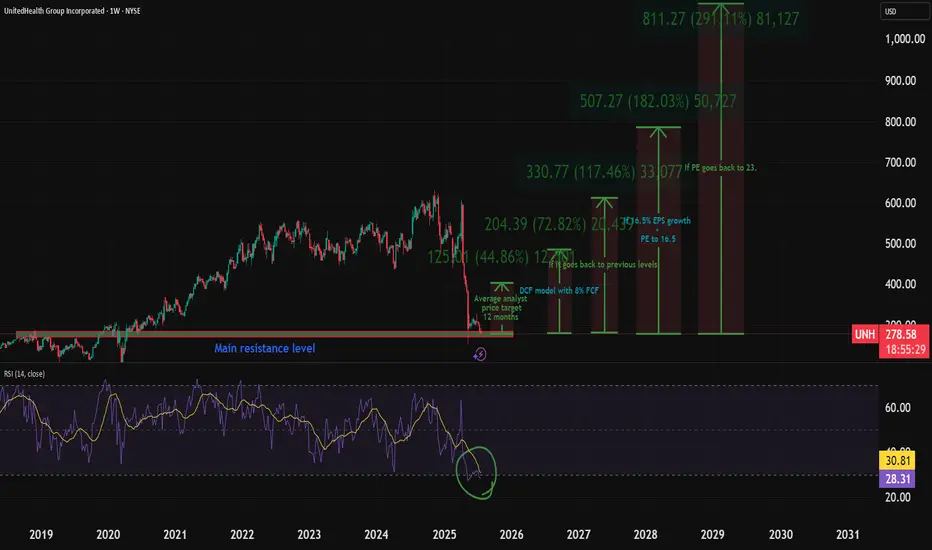
My UNH Thesis: Betting on a Healthcare Giant's Come BackThe healthcare sector has been in decline, which creates interesting opportunities. I recently talked about a few pharma plays - Eli Lilly, Novo Nordisk, and Pfizer.
Here's why I'm investing in NYSE:UNH :
UnitedHealth Group (UNH) has tanked ~50% in the past year, but the July 29 (VERY SOON) ea
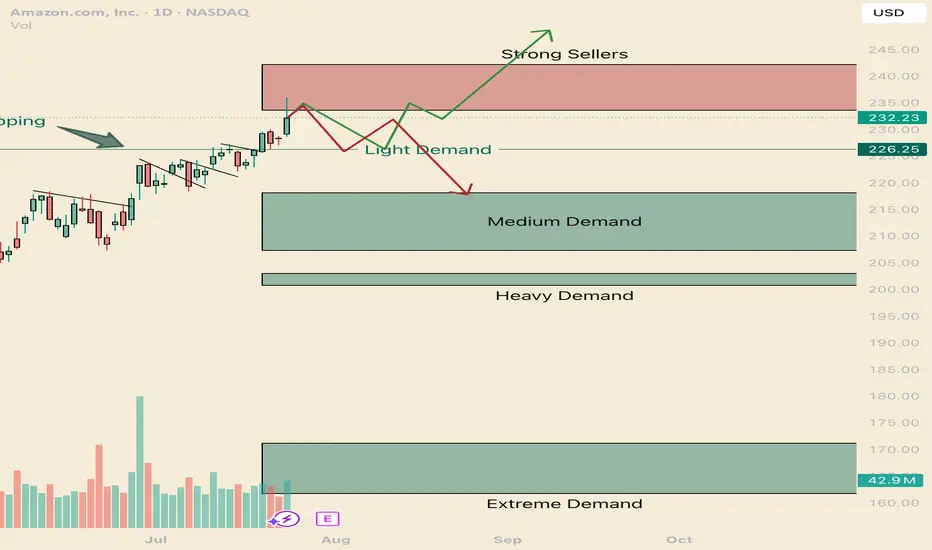
How to navigate the Amazonian Squeeze. AMZNHello I am the Cafe Trader.
This week has been a deep dive on the MAG 7 and today AMZN is up next.
We are going to look at long term and short term opportunities.
We are near the All Time Highs, with one final Seller to get through before making the break.
Today we tested to see if those sellers
GBPUSD Traders Beware: A Major Drop Could Be ComingThe classic rule says what doesn’t go up must come down. After a failed breakout at 1.3439, GBPUSD is struggling. With longs sitting on big gains from January’s low, a drop toward 1.3361 or even lower looks likely. Watch this key level now.
This content is not directed to residents of the EU or

See all editors' picks ideas
Trend Range Detector (Zeiierman)█ Overview
Trend Range Detector (Zeiierman) is a market structure tool that identifies and tracks periods of price compression by forming adaptive range boxes based on volatility and price movement. When prices remain stable within a defined band, the script dynamically draws a range box; when p

BE-Indicator Aggregator toolkit█ Overview:
BE-Indicator Aggregator toolkit is a toolkit which is built for those we rely on taking multi-confirmation from different indicators available with the traders. This Toolkit aid's traders in understanding their custom logic for their trade setups and provides the summarized results o

Intrabar Efficiency Ratio█ OVERVIEW
This indicator displays a directional variant of Perry Kaufman's Efficiency Ratio, designed to gauge the "efficiency" of intrabar price movement by comparing the sum of movements of the lower timeframe bars composing a chart bar with the respective bar's movement on an average ba

Strategy█ OVERVIEW
This library is a Pine Script™ programmer’s tool containing a variety of strategy-related functions to assist in calculations like profit and loss, stop losses and limits. It also includes several useful functions one can use to convert between units in ticks, price, currency or a per

Signs of the Times [LucF]█ OVERVIEW
This oscillator calculates the directional strength of bars using a primitive weighing mechanism based on a small number of what I consider to be fundamental properties of a bar. It does not consider the amplitude of price movements, so can be used as a complement to momentum-based osc

Estimated Time At Price [Kioseff Trading]Hello!
This script uses the same formula as the recently released "Volume Delta" script to ascertain lower timeframe values.
Instead, this script looks to estimate the approximate time spent at price blocks; all time estimates are in minute.second format.
The image above shows functionality.

Volume Profile, Pivot Anchored by DGTVolume Profile (also known as Price by Volume ) is an charting study that displays trading activity over a specified time period at specific price levels. It is plotted as a horizontal histogram on the finacial isntrumnet's chart that highlights the trader's interest at specific price levels. Specif

Fair Value MSThis indicator introduces rigid rules to familiar concepts to better capture and visualize Market Structure and Areas of Support and Resistance in a way that is both rule-based and reactive to market movements.
Typical "Market Structure" or "Zig-Zag" methods determine swing points based on fixed t

TextLibrary "Text"
library to format text in different fonts or cases plus a sort function.
🔸 Credits and Usage
This library is inspired by the work of three authors (in chronological order of publication date):
Unicode font function - JD - Duyck
UnicodeReplacementFunction - wlhm

Risk Distribution HistogramStatistical risk visualization and analysis tool for any ticker 📊
The Risk Distribution Histogram visualizes the statistical distribution of different risk metrics for any financial instrument. It converts risk data into histograms with quartile-based color coding, so that traders can understand th

See all indicators and strategies
News didn't load
Looks like that didn't go very well. Let's try again.
Community trends
Amd - New all time highs will follow!🪠Amd ( NASDAQ:AMD ) rallies even much further:
🔎Analysis summary:
After Amd perfectly retested a major confluence of support a couple of months ago, we saw a textbook reversal. This retest was followed by a rally of more than +100% in a short period of time. But considering all the bullish mo

MRVL | Ichimoku Breakout Setup with Fractal and MACDMarvell Technology (MRVL) just printed a clean bullish breakout setup across multiple technical systems. Here's the breakdown:
Why This Setup Matters
Ichimoku Cloud: Price has decisively cleared the cloud with bullish Tenkan-Kijun alignment. The Senkou Span A is rising, and the cloud ahead is thin
The 5 different types of Professional TradersLearn what each professional trader group trades, how they trade, when they trade and why they trade.
There are:
Sell Side Institution Floor Traders
Buy Side Institution Floor Traders
Proprietary Desk Traders (prop)
Specialist Professional Traders
Independent Professional traders.
Each type of profe

Incoming 40% correction for FacebookOn the above 10 day chart price action has rallied 500% since October 2022. It is somewhat unfortunate to see so many long ideas at the moment.
Motley Fool August 8th:
“Here's how Meta could achieve a $2 trillion valuation within three years, and if it does, investors who buy the stock today could

SMCI WEEKLY CALL SETUP (07/28/25)
### 🔹 SMCI WEEKLY CALL SETUP (07/28/25)
**Bullish Flow + Strong RSI = 🚀 Call Opportunity at \$62**
---
### 📊 TECHNICAL SNAPSHOT
* **RSI (Daily + Weekly):** ✅ Above 55 — clear bullish strength
* **Weekly Close:** 🔼 Broke prior highs — momentum continuation likely
* **Volume Ratio:** Slightly we

Tesla Stock in Bearish Trend - Further Downside ExpectedTesla Stock in Bearish Trend - Further Downside Expected
Tesla's (TSLA) stock price continues to display a clear bearish trend structure, characterized by the formation of consistent lower lows and lower highs on the price chart. This technical pattern suggests sustained selling pressure and indica

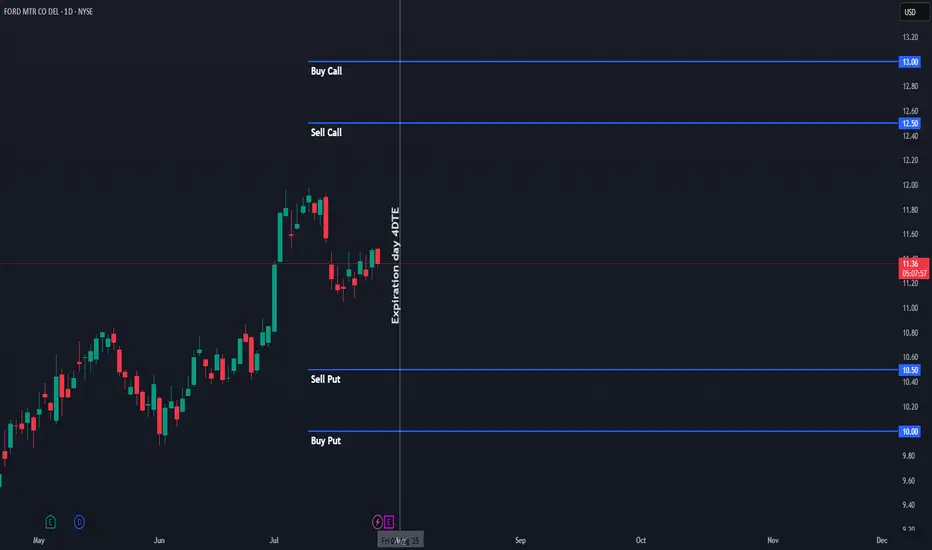
$F Iron Condor – Aug 1st Expiration | $7 Credit | I’m opening an Iron Condor on Ford ($F) with expiration on Friday, August 1st, 2025. The trade is based on the daily chart, using visible support/resistance levels to define the range. I selected strikes with approximately 0.15 delta on each side, giving the setup a high probability of success.
🔹 T
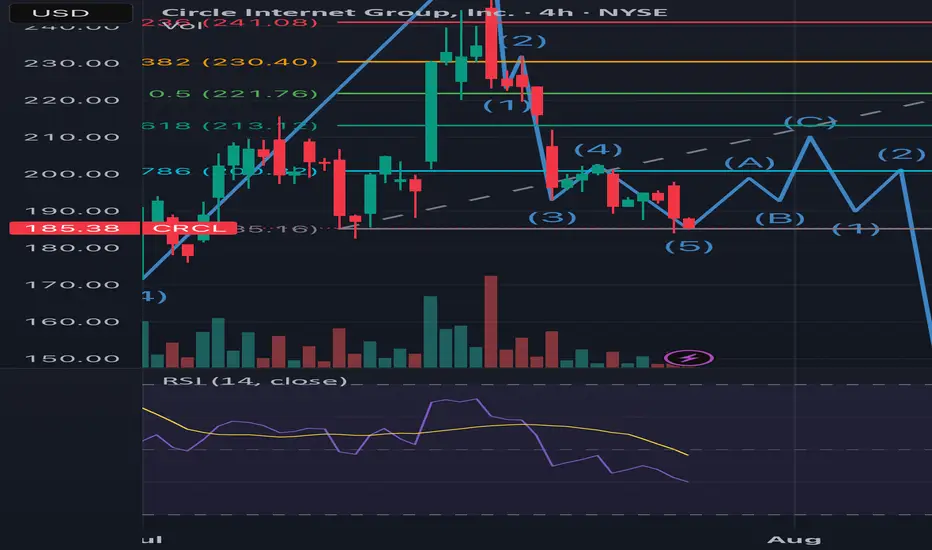
What goes around comes full CRCLFor the record, I bought in at ~$220 and looking to exit to ethical reasons. I believe that this stock will reach over $400USD for the end of the year but with every l opportunity left off for a greater cause, there will always be a greater reward.
1. Notice the end of the first 5 wave Elliot Impul
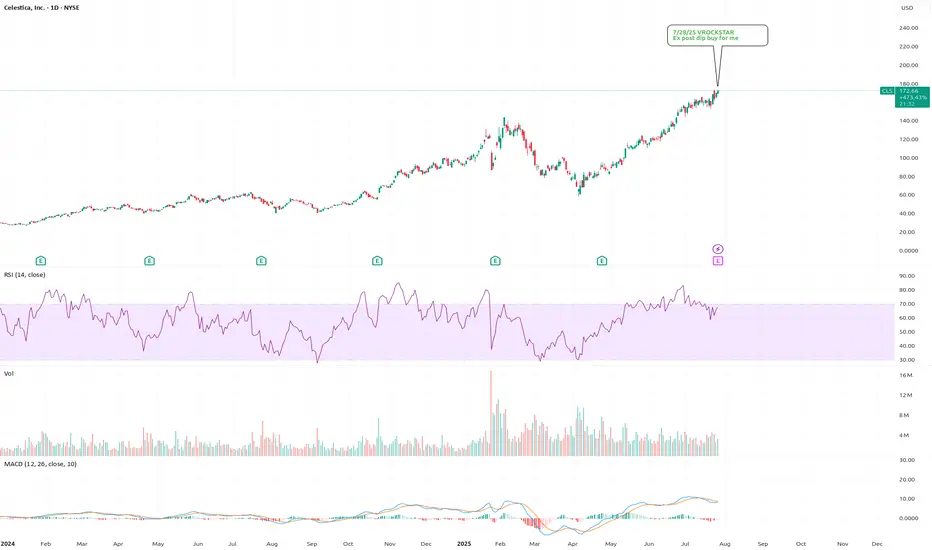
7/28/25 - $cls - Ex post dip buy for me7/28/25 :: VROCKSTAR :: NYSE:CLS
Ex post dip buy for me
- reminds of NYSE:GEV , great product, backlog, growth etc. etc.
- valuation at 2.5% fcf yield, low leverage and mid teens EBITDA for teens EBITDA growth++ is v reasonable
- don't really have an edge here, except to say.. i think any "miss"
BearishI have a feeling that Micron's gonna retest $109 or blow through it and run for the 200 moving average. Waiting to see a bullish divergence in the RSI, or for it to get out of this little downtrend it's forming

See all stocks ideas
Today
AUDCAudioCodes Ltd.
Actual
0.14
USD
Estimate
0.16
USD
Today
LADLithia Motors, Inc.
Actual
10.24
USD
Estimate
9.24
USD
Today
UNHUnitedHealth Group Incorporated
Actual
4.08
USD
Estimate
4.48
USD
Today
UPSUnited Parcel Service, Inc.
Actual
1.55
USD
Estimate
1.56
USD
Today
SWKStanley Black & Decker, Inc.
Actual
1.08
USD
Estimate
0.42
USD
Today
CCBCoastal Financial Corporation
Actual
0.71
USD
Estimate
0.84
USD
Today
AWIArmstrong World Industries Inc
Actual
2.09
USD
Estimate
1.78
USD
Today
CSTMConstellium SE
Actual
0.13
USD
Estimate
0.30
USD
See more events
News didn't load
Looks like that didn't go very well. Let's try again.
Community trends
BTC - Bulls vs Bears: who will win?Market Context
Bitcoin is trading in a tight consolidation just below its all-time high after a strong impulsive rally. This phase represents a balance of power between buyers and sellers, with neither side able to take control yet. Such a pause in momentum at this key level often builds pressure f
ALGO Breaks Out of Falling Wedge – 400% Target Ahead?BINANCE:ALGOUSDT has consistently followed a bullish pattern on the weekly timeframe. Each major rally has been preceded by a falling wedge breakout, as shown by the three highlighted instances on the chart.
- First breakout: ~200%+ move
- Second breakout: ~300%+ move
- Current breakout projection
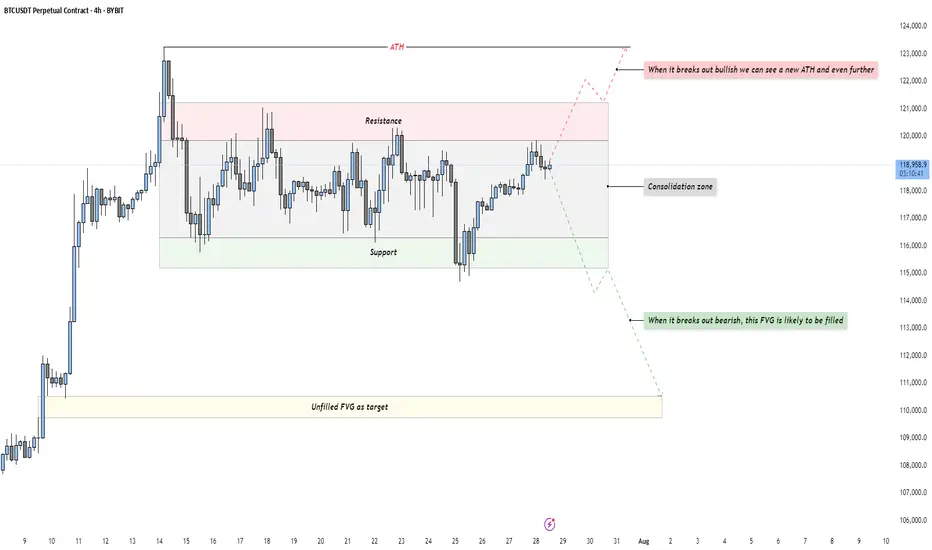
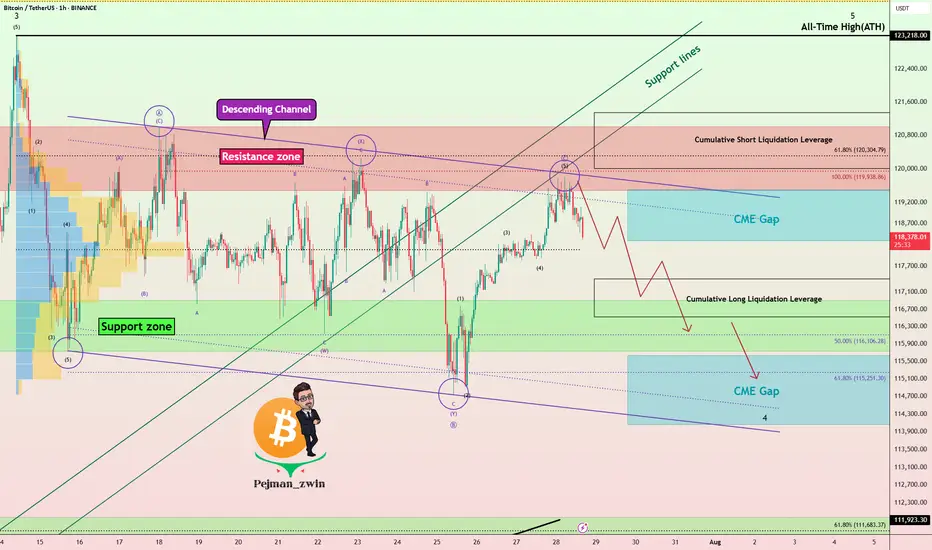
Bitcoin Rejected Near $120K – Bears Wake Up!First of all, I have to say that Bitcoin’s movements over the last 12 days have been a bit difficult to trade , generally, the hardest market to make a profit in is the range market with a swing movement .
Bitcoin( BINANCE:BTCUSDT ) is currently trading near the Resistance zone($121,000
BITCOIN - Price can correct to support area and then start riseHi guys, this is my overview for BTCUSD, feel free to check it and write your feedback in comments👊
For a significant period, the price of Bitcoin was trading upwards within the confines of a rising channel.
Strong buying pressure led to a breakout above the channel's upper boundary, signaling an

#BTCUSDT: Minor Correction In Price Then $150,000?Hi everyone,
Hope you are doing great we are witnessing some minor bearish correction in the price and think this might be a sellers trap. We think $110,000 can be a good area to buy. Our target is at $150,000 area which look possible after looking at how price recently behaved.

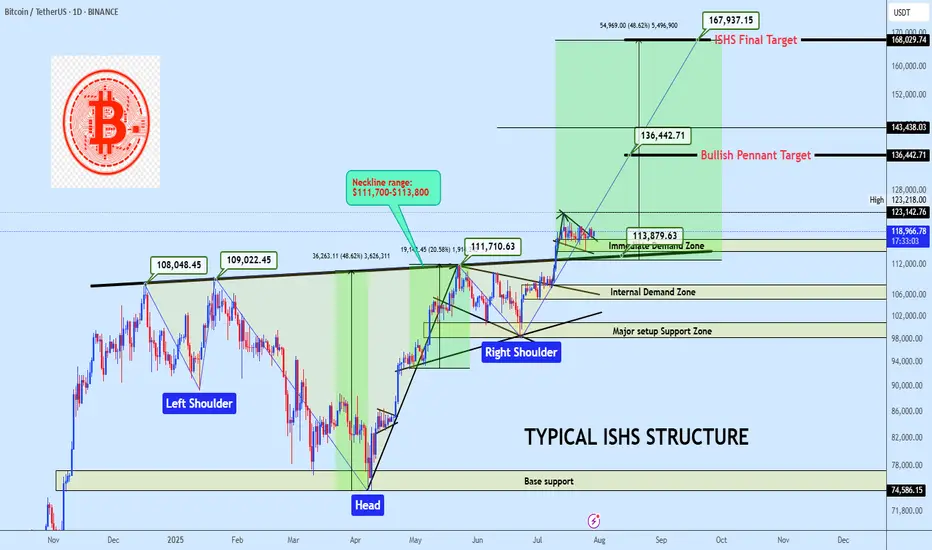
BTCUSDT ISHS Breakout with Bullish Pennant ContinuationBTC is holding above a clean neckline breakout from a inverse head and shoulders formation, currently consolidating inside a bullish pennant. A breakout from this range offers continuation potential to $136K and possibly to $168K. Bias remains bullish while price holds above the $114K region.
Mar
Ethereum at a Critical Crossroad: Will $4,000 Finally Break ?Ethereum is once again approaching the psychologically significant $4,000 resistance level, a high-timeframe barrier that has rejected price on multiple occasions. As the second-largest cryptocurrency by market cap pushes higher, traders are closely watching for signs of a breakout—or another range-

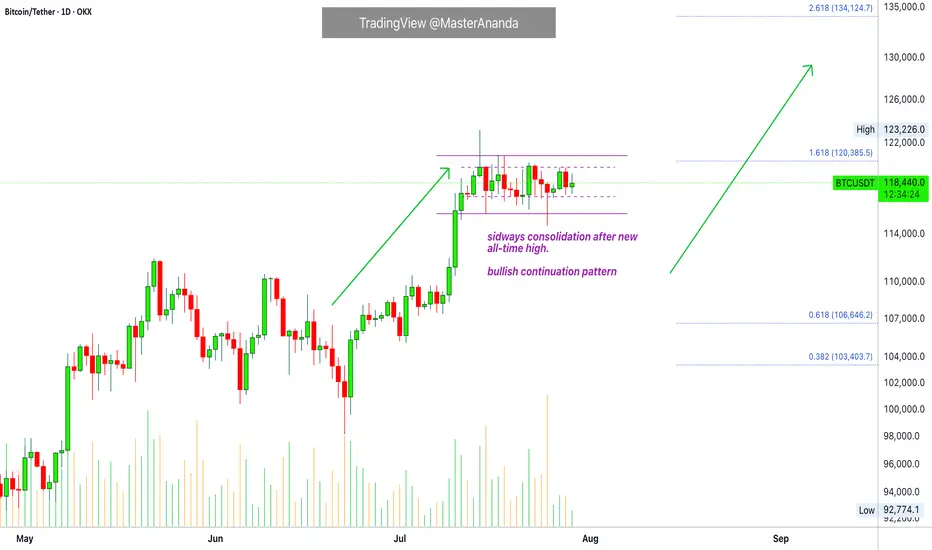
Bitcoin & The Altcoins —Name Your AltcoinBitcoin is sideways right now and is moving in a very tight and narrow range. All the action has been happening between $117,000 and $120,000 based on candle close since 11-July. This is bullish, think about it.
Bitcoin hits a new all-time high and next thing you know it turns sideways very close t
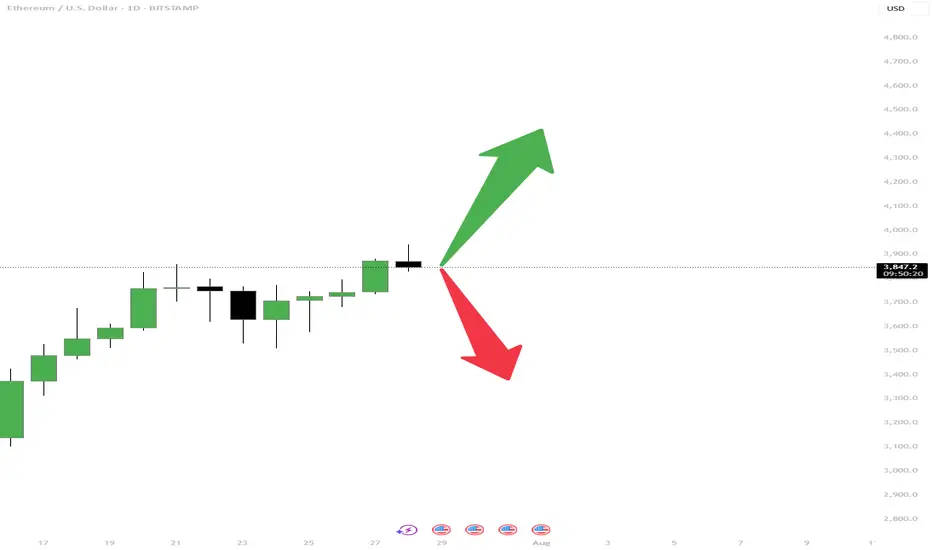
ETH is at a turning point — What would you do?Hey traders, how's everything going with you?!
The price has been increasing for days, but now it’s slowing down. From here, ETH can either:
🟢 Go higher and continue the uptrend
🔴 Or drop and start a pullback
This is a key moment. Some traders are preparing to buy the breakout, others are waitin
6/ Altseason: Live - Is this really the Altseason?12day Result I know this is the exact question you're asking yourselves as you look at your portfolios. "What altseason? Everything is flat."
Maybe I was wrong two weeks ago when I said it had already started. But, as they say, the result speaks for itself.
12 days ago, as part of the Altseason Live challen

See all crypto ideas
News didn't load
Looks like that didn't go very well. Let's try again.
Gold : Holding Ground Below 3345 Amid USD SurgeGold : Holding Ground Below 3345 Amid USD Surge
Gold's upward potential from Friday appears limited by the 3345 level—a narrow but firm resistance zone. As long as price fails to break above it, this zone has a high importance.
If gold holds below 3345, the probability of further downside increas

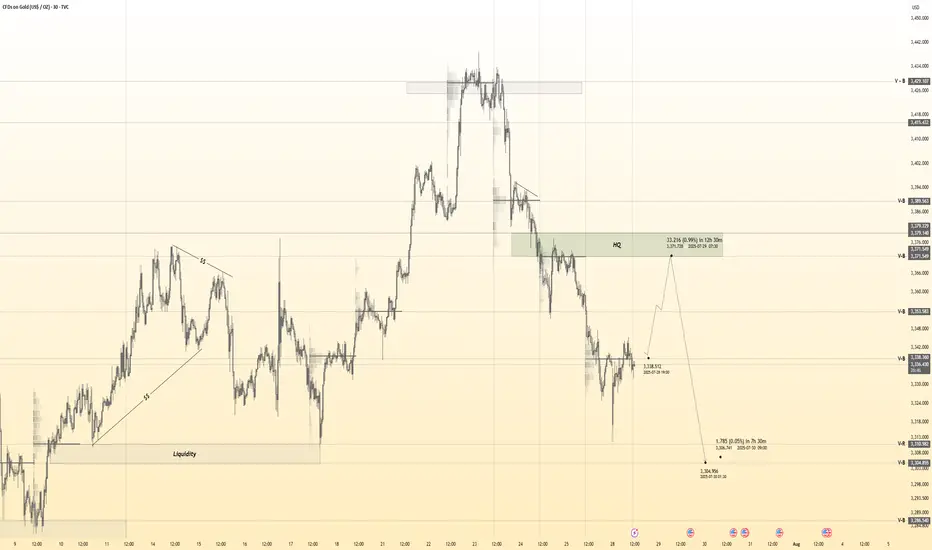
HelenP. I Gold can continue to decline to support zoneHi folks today I'm prepared for you Gold analytics. If we look at the price chart, we can observe a significant shift in the market structure, highlighted by the recent decisive break of a long-standing ascending trend line. This event suggests that the previous bullish momentum has been exhausted a
Lingrid | GOLD Weekly Market Outlook: Resistance Zone RejectionOANDA:XAUUSD markets have encountered significant resistance at the $3,450 level, resulting in a notable rejection and subsequent pullback toward support zones. The precious metal is now testing critical technical levels that will determine whether the broader bullish momentum can be sustained or i

GOLD ROUTE MAP UPDATEHey Everyone,
Please see update on our 1H chart route map.
Gold continued its bearish momentum into today, hitting our bearish target at 3238, while leaving the 3348 bullish gap still open.
After a break below 3328, price followed through and hit 3305, entering our key retracement range, which ga

Hellena | GOLD (4H): LONG to resistance area of 3440 (Wave V).As you can see, everything turned out to be more complicated than I had previously thought. We are dealing with a complex correction and a diagonal. I believe that the “ABCDE” waves, which make up the corrective wave “4”, are completing their levels, and I continue to expect the upward movement to c

GOLD (XAUUSD): Important BreakoutsI've identified two significant breakouts on 📉GOLD.
The price violated a crucial intraday horizontal support and a major rising trend line.
These broken levels now form a contracting supply zone, suggesting that the price could continue to decline.
Target levels are 3314 and 3289.

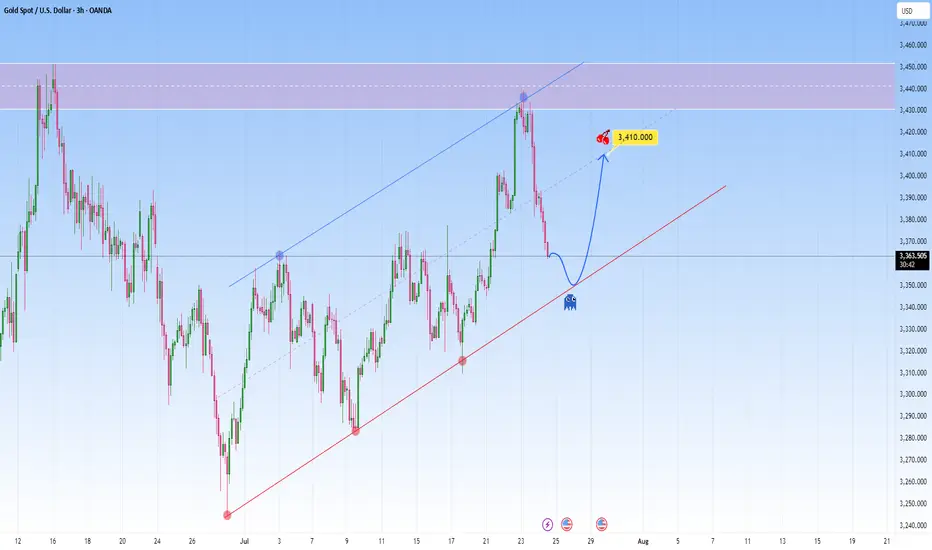
The correction is quite surprise. What direction for GOLD price?✏️Quite surprised with the adjustment of gold at the end of the previous trading week. The rising price channel is still holding around the lower border of the price channel around 3316. A liquidity sweep and candle wick removal in this area is considered a good buying opportunity.
If h1 closes bel
GOLD → Retest of trend support. Consolidation...GOLD is consolidating below the previously broken trend support. On Sunday, Trump announced a trade deal with the EU, which is putting pressure on the market along with the rising dollar...
Gold rebounded from support at $3310 after a week-long low, interrupting a three-day decline amid profit-ta

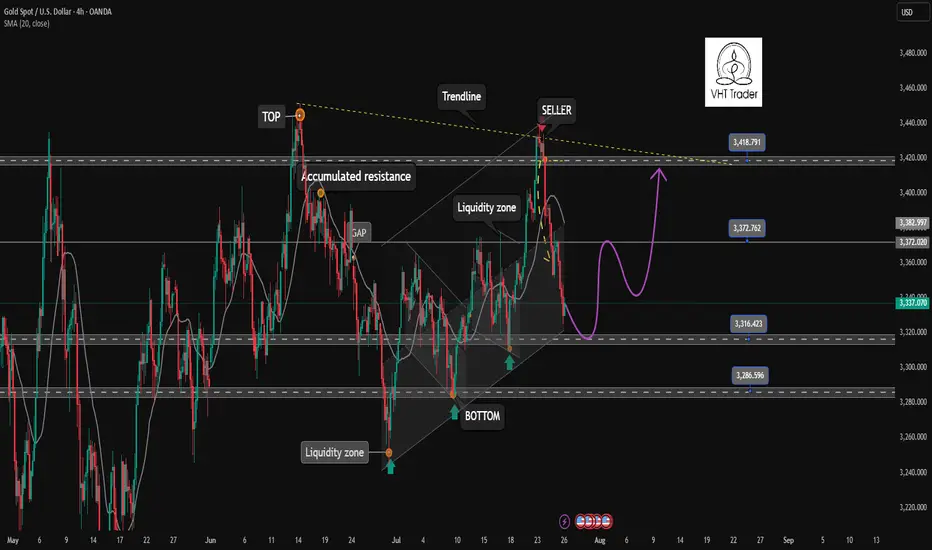
GOLD Reawakened: Corrects firmly but conditions remain bullishFrom a technical perspective Gold is climbing in a parallel channel, clearly bullish with a rhythm that’s hard to ignore. Price just bounced off the resistance with force, a classic overextension flush.
And the market is now approaching the lower boundary of this projected channel. This confluence
Gold 30Min Engaged ( Bullish After Break Out Entry Detected )———
Time Frame: 30-Minute Warfare
Entry Protocol: Only after volume-verified breakout
🩸Bullish Break - 3339
➗ Hanzo Protocol: Volume-Tiered Entry Authority
➕ Zone Activated: Dynamic market pressure detected.
The level isn’t just price — it’s a memory of where they moved size.
Volume is rising ben
See all futures ideas
News didn't load
Looks like that didn't go very well. Let's try again.
GBPCAD At Support - High probability reversalGBPCAD descended with strength, and has now reached a strong support zone.
Price now hovers above and this zone and is a great indication to use for possible reversal move, that could send price into the 1.86100 level.
But if price breaks below support with momentum, then I’ll back off this bullish

EURUSD – Will the bullish parallel channel hold?The EUR/USD currency pair is currently trading within a clearly defined bullish parallel channel, as shown on the 4-hour chart. This channel has provided consistent directional structure over recent weeks, with price respecting both its upper resistance and lower support boundaries. At present, the

EURO - Price can continue to move up inside rising channelHi guys, this is my overview for EURUSD, feel free to check it and write your feedback in comments👊
The price action of price reversed its course after breaking out from a previous falling channel formation.
Since then, the asset has been trading within the clear boundaries of a well-defined risin

EUR/USD Bullish Reversal Setup – 1H ChartEUR/USD 1H Chart Setup:
The chart shows a potential bullish reversal setup after a downtrend. Entry is marked near 1.15867 with a target at 1.17953 and a stop loss set at 1.15092. The trade anticipates a strong upward move following the downward pressure.

USDCAD: a long positionHello guys.
Divergence:
A bullish RSI divergence is noted, price made lower lows while RSI formed higher lows, signaling a potential bullish reversal.
Price Action:
Price has bounced strongly from around the 1.3570–1.3580 zone and is now approaching a descending trendline resistance.
Trade Setup

Euro will rebound from support line of wedge to resistance levelHello traders, I want share with you my opinion about Euro. After breaking out decisively from a prior downward channel, the euro initiated a significant structural shift, moving from a clear downward trend into a new and more volatile market condition. This transition has led to the development of

EURUSD Potential UpsidesHey Traders, in today's trading session we are monitoring EURUSD for a buying opportunity around 1.16 zone, EURUSD is trading in an uptrend and currently is in a correction phase in which it is approaching the trend at 1.16 support and resistance area.
Trade safe, Joe.

29.07.25 Morning ForecastPairs on Watch -
FX:EURGBP
FX:AUDUSD
FX:NZDUSD
A short overview of the instruments I am looking at for today, multi-timeframe analysis down to what I will be looking at for an entry. Enjoy!

GBP/CAD - H4 - Bearish Flag (26.07.2025)The GBP/CAD Pair on the H4 timeframe presents a Potential Selling Opportunity due to a recent Formation of a Bearish Flag Pattern. This suggests a shift in momentum towards the downside in the coming Days.
Possible Short Trade:
Entry: Consider Entering A Short Position around Trendline Of The P

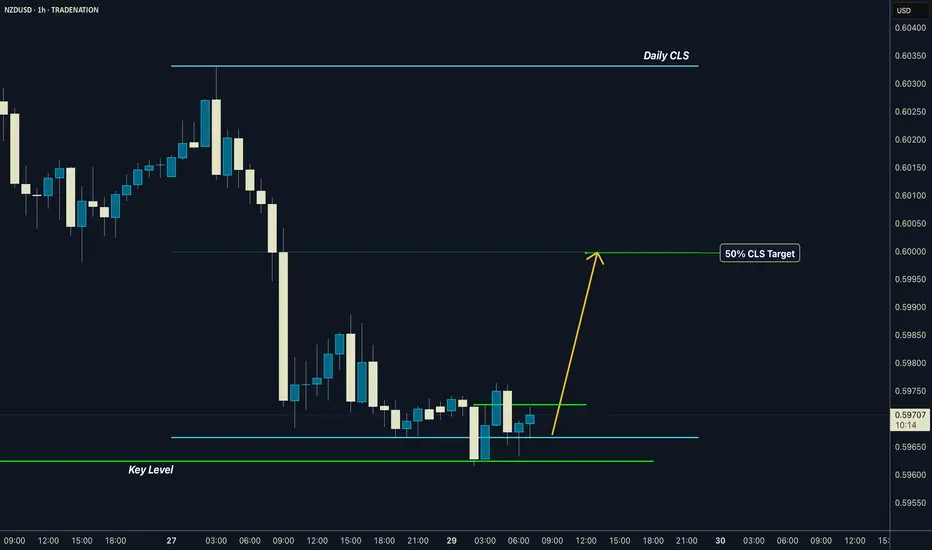
NZDUSD | Daily CLS I Model 1 I 50% CLS TargetHey, Market Warriors ⚔️
Fresh outlook drop — if you’ve been riding with me, you already know:
🎯My system is 100% mechanical. No emotions. No trend lines. No subjective guessing. Just precision, structure, and sniper entries.
🧠 What’s CLS?
It’s the real smart money. The invisible hand behind $7
See all forex ideas
| - | - | - | - | - | - | - | ||
| - | - | - | - | - | - | - | ||
| - | - | - | - | - | - | - | ||
| - | - | - | - | - | - | - | ||
| - | - | - | - | - | - | - | ||
| AUD | - | - | - | - | - | - | - | |
| CNY | - | - | - | - | - | - | - | |
| CAD | - | - | - | - | - | - | - |
News didn't load
Looks like that didn't go very well. Let's try again.
Trade directly on the supercharts through our supported, fully-verified and user-reviewed brokers.


