27% Cheaper Than Buffett’s Buy – And Sitting on a Key ZoneHi,
One of the most recent and notable additions to Berkshire Hathaway’s portfolio is Constellation Brands NYSE:STZ — and if that’s not a fundamental vote of confidence, I don’t know what is.
And hey, while Midsummer Day is behind us, warm and sunny summer evenings still lie ahead. So why not ma

The best trades require research, then commitment.
Get started for free$0 forever, no credit card needed

Scott "Kidd" PoteetThe unlikely astronaut

Where the world does markets
Join 100 million traders and investors taking the future into their own hands.

Ethereum at Key Resistance After Short Squeeze BounceEthereum recently found a local bottom at $2,111, triggering a sharp bounce that resembles a short squeeze. However, the rally has met a significant resistance zone—a former support level now flipped into resistance. This zone is technically loaded with multiple confluences: the point of control, th

Nasdaq All-Time Highs, S&P Close, Blast Off or Breakdown?What an incredible melt-up since April 7 lows in the US markets.
Trump vs Musk - ignored
Iran vs Israel - ignored
High Valuations - ignored
FED Pausing - ignored
The US economy is resilient and it's a good thing because the world is performing really well (EX-US). Europe/China/India/Emerging Marke

AUD/USD, AUD/JPY: Soft CPI A Gift For RBA Doves?I have long said that the RBA could cut in July, and today's CPI figures all but confirm one is on tap. But with AUD/USD and AUD/JPY are rising, will bears get their say?
Matt Simpson, Market Analyst at City Index and Forex.com

Ride UBER to $300.00 The chart of Uber Technologies Inc. (UBER) showcases a multi-year bullish setup following a prolonged accumulation phase and key breakout signals:
Consolidation: The stock entered a horizontal consolidation phase above previous resistance, now acting as strong support ($60–$80), confirmed by multip

Bitcoin Analysis 23-Jun-25Bitcoin price in the weekend retested around 98,500$, this drop was mainly supported by the fear in the markets due to the escalations in the Middle East, & the US taking part in the War.
In this short analysis video, we will be discussing the Areas of interest and possible price movement we coul

Coffee just gave a two-bar reversal to go long6 23 25 oil just went higher presumably from what happened with Tehran... and I heard several people say that oils going a lot higher. I really don't believe that but more importantly we can use some of the tools on the chart to decide when to take trades as a buyer and a seller. there's a cl

Tesla Rolls Out Much-Awaited Robotaxis. Buy or Sell the Stock?They’re here. After years of tweets, teasers, and timelines that aged like unrefrigerated dairy, Tesla NASDAQ:TSLA officially launched its long-awaited robotaxi service in Austin, Texas.
The self-driving revolution, we were told, would arrive like a lightning bolt. Instead, it quietly rolled up

Will Nike’s Upcoming Earnings ‘Just Do It’ for Investors?This hasn’t been the greatest year for Nike NYSE:NKE , which will report earnings next Thursday at a time when the stock is down more than 20% year to date. What does technical and fundamental analysis say might happen to the stock from here?
Let’s take a look:
Nike’s Fundamental Analysis
NKE

Is Alt season dead? - June 2025Let me start by saying, Youtube influencers are lying to you. The collective narrative (from those links shared with me) talk almost exclusively about the same set of narratives for triggering “alt season”:
M2 money supply. The printer will be turned on any minute.
The FED is going to cut rat

See all editors' picks ideas
Color█ OVERVIEW
This library is a Pine Script® programming tool for advanced color processing. It provides a comprehensive set of functions for specifying and analyzing colors in various color spaces, mixing and manipulating colors, calculating custom gradients and schemes, detecting contrast, and con

Tensor Market Analysis Engine (TMAE)# Tensor Market Analysis Engine (TMAE)
## Advanced Multi-Dimensional Mathematical Analysis System
*Where Quantum Mathematics Meets Market Structure*
---
## 🎓 THEORETICAL FOUNDATION
The Tensor Market Analysis Engine represents a revolutionary synthesis of three cutting-edge mathematical framework

SIP Evaluator and Screener [Trendoscope®]The SIP Evaluator and Screener is a Pine Script indicator designed for TradingView to calculate and visualize Systematic Investment Plan (SIP) returns across multiple investment instruments. It is tailored for use in TradingView's screener, enabling users to evaluate SIP performance for various as

Wavelet-Trend ML Integration [Alpha Extract]Alpha-Extract Volatility Quality Indicator
The Alpha-Extract Volatility Quality (AVQ) Indicator provides traders with deep insights into market volatility by measuring the directional strength of price movements. This sophisticated momentum-based tool helps identify overbought and oversold conditio

Bitcoin Power Law Clock [LuxAlgo]The Bitcoin Power Law Clock is a unique representation of Bitcoin prices proposed by famous Bitcoin analyst and modeler Giovanni Santostasi.
It displays a clock-like figure with the Bitcoin price and average lines as spirals, as well as the 12, 3, 6, and 9 hour marks as key points in the cycle.
🔶

Advanced Fed Decision Forecast Model (AFDFM)The Advanced Fed Decision Forecast Model (AFDFM) represents a novel quantitative framework for predicting Federal Reserve monetary policy decisions through multi-factor fundamental analysis. This model synthesizes established monetary policy rules with real-time economic indicators to generate proba

Timeframe LoopThe Timeframe Loop publication aims to visualize intrabar price progression in a new, different way.
🔶 CONCEPTS and USAGE
I got inspiration from the Pressure/Volume loop, which is used in Mechanical Ventilation with Critical Care patients to visualize pressure/volume evolution during inhal

Deviation Trend Profile [BigBeluga]🔵 OVERVIEW
A statistical trend analysis tool that combines moving average dynamics with standard deviation zones and trend-specific price distribution.
This is an experimental indicator designed for educational and learning purposes only.
🔵 CONCEPTS
Trend Detection via SMA Slope: Detect

Rolling Z-Score Trend [QuantAlgo]🟢 Overview
The Rolling Z-Score Trend measures how far the current price deviates from its rolling mean in terms of standard deviations. It transforms price data into standardized scores to identify overbought and oversold conditions while tracking momentum shifts.
The indicator displays a Z-S

Yelober - Sector Rotation Detector# Yelober - Sector Rotation Detector: User Guide
## Overview
The Yelober - Sector Rotation Detector is a TradingView indicator designed to track sector performance and identify market rotations in real-time. It monitors key sector ETFs, calculates performance metrics, and provides actionable stock

See all indicators and strategies
News didn't load
Looks like that didn't go very well. Let's try again.
Community trends
TESLA..(TSLA) 30M TIME FRAME..Tesla (TSLA) on a 30-minute timeframe using Ichimoku Cloud along with trendlines and breakout levels.
There are two target levels indicated:
---
🔵 Immediate Target Point (Breakout Target):
Price Level: ~$350
This seems to be the first breakout target if price breaks above the current resistanc

6/26/25 - $gme - Pwn the BTC treasury game6/26/25 :: VROCKSTAR :: NYSE:GME
Pwn the BTC treasury game
- everyone is focused on the wanna be Strategy try-co's
- but there is only one BTC and there is only one Strategy
- GME just issues 2 bn+ of 0% convert paper (the secret sauce to MSTR) and nobody blinks?
- You think Pomp can easily do th

TSLA PRICE ACTION JUNE 25 2025This is the price action for Tesla. I have discussed all the levels. I have given a trade today & have discussed it thoroughly.
If you have any doubts, then feel free to Dm me or leave a comment below
NOTE:DO NOT BUY CALLS

Micron Technology - Another +50% rally will follow!Micron Technology - NASDAQ:MU - will rally another +50%:
(click chart above to see the in depth analysis👆🏻)
About two months ago Micron Technology perfectly retested a confluence of support. This retest was followed by bullish confirmation, nicely indicating a reversal. So far we saw a rally o

27% Cheaper Than Buffett’s Buy – And Sitting on a Key ZoneHi,
One of the most recent and notable additions to Berkshire Hathaway’s portfolio is Constellation Brands NYSE:STZ — and if that’s not a fundamental vote of confidence, I don’t know what is.
And hey, while Midsummer Day is behind us, warm and sunny summer evenings still lie ahead. So why not ma
SOSPrice completing SOS phase of Wyckoff accumulation
Symmetrical triangle almost reached the break point and a strong move will soon happen
I expect an upward move but always set a stop loss to protect your money

SEALSQ CORP. Chart talk about Adam and Eve pattern at the Bottom.
Target prices between 22$ - 25.80$ .
Highly recommended for Buying now.

BUY Deck!!!This is a good opportunity to look out for. We can see that market structure is clearly inducing early buyers to perhaps wipe them out with another bearish leg down to our major demand level.
Looking to set some buy orders at our next major zone to ride this stock up to previous all time highs.
G

Bearish Divergences - Short TriggeredThis move up in the fifth wave is showing a bearish divergence on the RSI. I expected us to reach the $146-150 level. I have entered a short position with a tight stop loss. Nobody knows when the party's over, I'll take my chance here and if I am proven wrong, it will only be at a small loss.
Not

Verizon is ready to pop!This stock rallies when 10-year yields fall. Especially if tech stocks take a breather. Tech stocks are on average well into over-bought territory, and 10-year yields have been falling precipitously. Verizon is highly stable and provides a massive dividend which investors flock to when yields fall,

See all stocks ideas
Today
APOGApogee Enterprises, Inc.
Actual
0.56
USD
Estimate
0.47
USD
Today
IGCIGC Pharma, Inc.
Actual
—
Estimate
−0.02
USD
Today
MEIMethode Electronics, Inc.
Actual
—
Estimate
−0.01
USD
Today
RDUSRadius Recycling, Inc.
Actual
—
Estimate
−0.40
USD
Today
QMCOQuantum Corporation
Actual
—
Estimate
−1.16
USD
Today
FIZZNational Beverage Corp.
Actual
—
Estimate
0.48
USD
Today
FNGRFingerMotion, Inc.
Actual
—
Estimate
—
Today
CNVSCineverse Corp.
Actual
0.04
USD
Estimate
−0.08
USD
See more events
Community trends
BTC - Double Top after Liquidity Sweep?Price has recently executed a Buy Side Liquidity Sweep just above the previous high. This type of move often signals a potential shift in market direction, especially when followed by signs of exhaustion or failure to push higher. In this case, price has formed a double top near the 106,600 level,

Bitcoin - Time to sell, huge drop will follow (must see!)Bitcoin is currently approaching a very strong resistance of this major bullish flag! We definitely want to sell resistances and buy supports, not the other way around, until we have confirmations. Bitcoin's price action is statistically very boring during summer seasons! Usually high volatility kic

Bitcoin may reach resistance level and then start to declineHello traders, I want share with you my opinion about Bitcoin. Previously, the price was trading inside a well-defined downward channel, repeatedly rebounding from both the support and resistance lines. Each upward move got rejected within the seller zone, especially around the 108500 - 109200 range

Bitcoin - Bullflag formation towards $111k?After the long and steep rally in Bitcoin that began on April 9th, the price is now entering a period of consolidation and forming a classic bullish continuation pattern known as a bull flag. This type of structure often appears after a strong impulsive move to the upside and signals that the market

Bitcoin Reaches PRZ with Bearish Signals — Is a Drop Imminent?Bitcoin ( BINANCE:BTCUSDT ) has reached the Potential Reversal Zone(PRZ) as I expected in yesterday's post .
Bitcoin is trading in the Heavy Resistance zone($110,720-$105,820) , Potential Reversal Zone(PRZ) , and near the Resistance lines .
In terms of Elliott Wave theory , it seems that

Ethereum at Key Resistance After Short Squeeze BounceEthereum recently found a local bottom at $2,111, triggering a sharp bounce that resembles a short squeeze. However, the rally has met a significant resistance zone—a former support level now flipped into resistance. This zone is technically loaded with multiple confluences: the point of control, th
Bitcoin - Bears Take Control, Reversal Coming?After an aggressive bullish rally, Bitcoin has filled a clean 1H imbalance zone near 108K and swept short-term liquidity above recent 1H highs. The move into premium pricing saw clear signs of rejection, with a strong bearish reaction directly inside the imbalance area. This reaction confirms the ar

BTCUSD I H8 CLS I Monthly OB I ATH Coming then $200KHey, Market Warriors, here is another outlook on this instrument
If you’ve been following me, you already know every setup you see is built around a CLS Footprint, a Key Level, Liquidity and a specific execution model.
If you haven't followed me yet, start now.
My trading system is completely

Setup: Entry at $108,658 with Target at $98,815 and Stop Loss at1. Entry Point: 108,658
This is where the trader expects to enter a short position.
Price is projected to reverse near this level.
2. Stop Loss: 110,341
Located above the entry point.
If price hits this level, the short trade is invalidated, limiting losses.
3. Target (Take Profit): 98,815

BTC - 108k?BTC looks it has power to go more up, remember the more it goes up the more shorts are active, but 108,500 good look for shorts as well!

See all crypto ideas
GOLD → Within range. Retest resistance at 3347FX:XAUUSD continues to correct after a false breakdown of support at 3300. Due to uncertainty, the price may remain in the range of 3300-3340 for some time.
Gold is fluctuating amid a weak dollar and uncertainty over Fed rates. Gold is struggling to hold on after rebounding from weekly lows, d

GOLD drops sharply to 3300 and found important support areaThe recent bearish momentum on GOLD has met a good support zone and at present we started to see early signs of bullish interest returning, right after we got a beautiful rejection from the zone.
Currently I’m expecting for the price to bounce to the target near 3,390 . If this bullish push conti

Lingrid | GOLD Potential Bullish Reversal TradeOANDA:XAUUSD is rebounding from key structure support after forming a double-leg corrective move inside an expanding triangle. Price has reclaimed the 3,324 zone, aligning with the trendline and support confluence, suggesting a short-term bullish bias. If this rebound sustains, gold could retest t

GOLD ROUTE MAP UPDATEHey Everyone,
A PIPTASTIC day on the markets with our analysis playing out in true level to level fashion.
Yesterday we stated that that we had the cross and lock below 3348 opening the swing range, which was hit perfectly and gave the bounce and that we will now wait to see if the full swing is

XAU/USD - Channel Breakout (26.06.2025)The XAU/USD pair on the M30 timeframe presents a Potential Buying Opportunity due to a recent Formation of a Channel Breakout Pattern. This suggests a shift in momentum towards the upside and a higher likelihood of further advances in the coming hours.
Possible Long Trade:
Entry: Consider Enterin

Gold: A Bearish Outlook - Another Point of ViewGold: A Bearish Outlook - Another Point of View
Since yesterday, gold has not moved much despite the situation in the Middle East looking calm and stable for the moment.
In a normal market, gold should have started another downward wave, given that a ceasefire was reached between the influential

GOLD H4 Accumulation Fractal Target is 4 000 USD 🏆 Gold Market Mid-Term Update
📉 Gold Pullback: XAU/USD drifted below $3,350, falling to around $3,325–$3,330 amid easing Middle East tensions and a firmer U.S. dollar.
🤝 Ceasefire Effect: De-escalation in Israel-Iran hostilities reduced safe-haven demand, capping gold’s upside.
💵 Fed & USD Dynamic

XAUUSD has been in a strong free fall following the sell strategXAUUSD has dropped sharply in a free fall, perfectly following the sell strategy from 3348–3350.
We have won.
Trading Strategy for XAUUSD OANDA:XAUUSD
Based on the current price structure and short-term bias, here are two tactical trade setups:
Sell Setup – If Price Rejects Resistance

XAUUSD: We must adapt to the market conditions! Bears in ChargeGold prices dropped as Trump announced a ceasefire between Iran and Israel, causing a significant decline. We anticipate this trend to persist, as recent price data, including volume and price momentum, indicates a strong seller’s control in the current market conditions. We have two targets for you

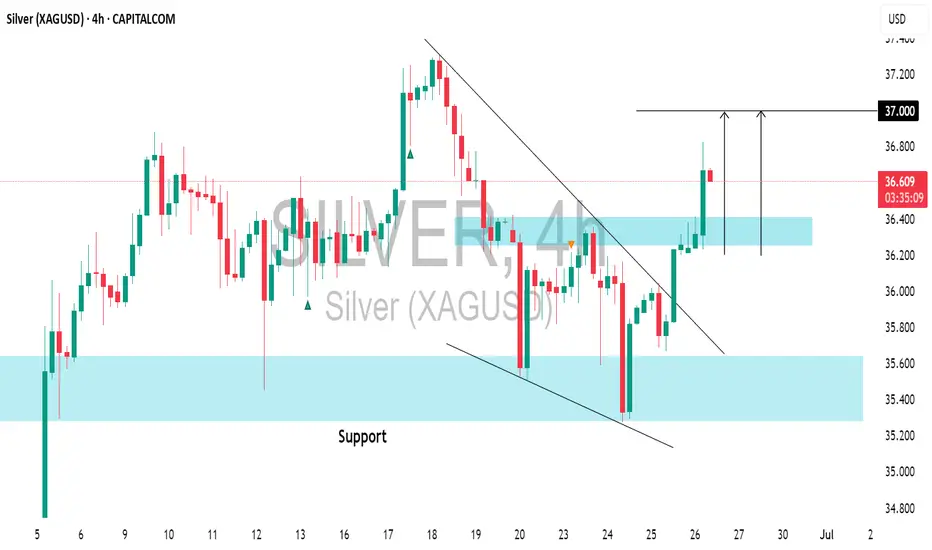
SILVER (XAGUSD): Intraday Bullish Confirmation?!📈SILVER appears to be on a bullish trend following a bounce off crucial daily/intraday horizontal support.
The price broke through a resistance line of a descending channel and created a local Change of Character (CHoCH).
There is a strong likelihood that the price will keep rising, with a targe
See all futures ideas
NZDCAD reached key resistance: Rebound to 0.82450 likelyPrice on NZDCAD has reached a pretty significant resistance level, that has been a key turning point in the past, with several strong reversals from the area. So naturally, I’ve been watching to see how price reacts here again.
We can already see early signs of rejection, so I will monitor this pai

GBPUSD Potential UpsidesHey Traders, in today's trading session we are monitoring GBPUSD for a buying opportunity around 1.37000 zone, GBPUSD is trading in an uptrend and currently is in a correction phase in which it is approaching the trend at 1.37000 support and resistance area.
Trade safe, Joe.

USDCAD Bearish Reversal Trade Setup – 3H Chart Analysis (June 26 Entry Zone: 1.37279 – 1.37554
🔹 Stop Loss: 1.37934
🔹 Target: 1.35278
🔹 Risk-to-Reward (RR): ~1:2.5
🧠 Technical Breakdown
Trend Overview:
Overall trend shows a downtrend from earlier June, followed by a corrective bullish move.
Price failed to sustain above the 200 EMA (blue line), indicating cont

USDJPY h4 strongly bullish opportunity Dip into/under support (~144.5)
2. Trap and reverse hard
3. Break above 148 with momentum
4. Stretch target → 149.50–150.20

Hellena | EUR/USD (4H): LONG to the resistance area 1.18466.Dear colleagues, I believe that the upward movement continues. The five-wave impulse is not over yet, and I see that the price is now in the upward wave “3” of the higher order and in the upward wave “3” of the lower order.
Therefore, I expect a small correction to the 1.16165 area, after which I e

USDCAD I Weekly CLS I Model 1I Target 3M CLS LowHey, Market Warriors, here is another outlook on this instrument
If you’ve been following me, you already know every setup you see is built around a CLS Footprint, a Key Level, Liquidity and a specific execution model.
If you haven't followed me yet, start now.
My trading system is completely

Analysis of Trades and Trading Tips for the GBP/USDThe test of the 1.3614level occurred when the RSI indicator had already risen significantly above the zero line, which limited the pair's upside potential. For this reason, I did not buy the GBP/USD.
There has been progress in the trade negotiations between China and the United States: yesterday, b

CHFJPY: Strong Bullish PatternI observe a bullish accumulation pattern, specifically an ascending triangle, on CHFJPY chart.
In a strong uptrend, this pattern typically suggests a high likelihood of bullish continuation.
The next buy signal will come from a bullish breakout above the neckline of the ascending triangle on the

NZDUSD Inside a Large ABCDE PatternNZDUSD Inside a Large ABCDE Pattern
The US dollar is lower across the board today as President Trump may accelerate the announcement of a successor to Federal Reserve Chairman Jerome Powell, as reported by the WSJ.
Investors are wary of the lack of independence from the Federal Reserve and expect

Free Friday Signal #AUDCAD Sell Setup#AUDCAD
SELL SETUP
ENTRY: 0.89130
SL: 0.89930
TP: 0.87904
Please use risk management . Markets can easily surprise us While in middle eastern we have this conflict . This is not financial advice but just our opinion on market.
Follow me for more our community ideas and have a sweet friday

See all forex ideas
| - | - | - | - | - | - | - | ||
| - | - | - | - | - | - | - | ||
| - | - | - | - | - | - | - | ||
| - | - | - | - | - | - | - | ||
| - | - | - | - | - | - | - | ||
| - | - | - | - | - | - | - | ||
| - | - | - | - | - | - | - | ||
| - | - | - | - | - | - | - |
Trade directly on the supercharts through our supported, fully-verified and user-reviewed brokers.


