Soaring platinum breaks a 3 year high at $1,152.50/ozChina, the world’s largest consumer of platinum, imported its highest amount in a year last month. Retail investment demand (bars and coins) in China more than doubled, overtaking North America as the top market for platinum investment.
Analysts at Bloomberg Intelligence predict that global platinum

The best trades require research, then commitment.
Get started for free$0 forever, no credit card needed

Scott "Kidd" PoteetThe unlikely astronaut

Where the world does markets
Join 100 million traders and investors taking the future into their own hands.

Elon Musk vs Trump: Who you betting on?Elon Musk and Donald Trump have recently had a public falling-out, with their feud playing out on social media and in political circles.
The dispute seems to have started over Trump's new budget bill, which Musk has criticized for increasing the national debt. Trump, in turn, accused Musk of being

OptionsMastery: Inverse head and shoulders on UAL! 🔉Sound on!🔉
📣Make sure to watch fullscreen!📣
Thank you as always for watching my videos. I hope that you learned something very educational! Please feel free to like, share, and comment on this post. Remember only risk what you are willing to lose. Trading is very risky but it can change your life!

The MSCI World index sets a new all-time record!The MSCI World stock market index set a new all-time record during the trading session of Monday June 2, wiping out the entire stock market shock of February/March, which saw the global equity market lose 20%. This technical signal still needs to be confirmed at the end of the week at the next weekl

USDJPY forms textbook head and shoulders patternOur last bearish call on USDJPY played out perfectly. Now, a new setup is forming. With US ISM data showing contraction and stock markets under pressure, the dollar-yen could be next to drop. Watch as we break down the textbook head and shoulders pattern and the levels to watch for a potential 600+

Do bulls have enough steam to drive gold higher?A lot of things to consider this week, a lot of data and geopolitical tensions. Will the economic uncertainty and potential bad US jobs data drive TVC:GOLD higher? Let's dig in.
FX_IDC:XAUUSD
Let us know what you think in the comments below.
Thank you.
77.3% of retail investor accounts lose

Bull market scenario LITECOINAt this period, I'm speaking about LITECOIN, which currently has one of the strongest bull-looking charts on cryptocurrency!
We may see the price testing Fibo's higher levels very soon...
A bull market may begin, so I recommend focusing on higher price markings...
On another market, like BTC, Ethe

TRVG - Basic Analysis can lead to great trade ideas!This is as simple as it gets. See a taper, be a taper!
Good trade opportunity incoming if we prove a breakout of red strong selling and we can make our way toward a HTF purple tapered selling and ultimately prove a HTF buying continuation in orange.
Happy Trading :)

Rate Cuts and Risky Bets: When the Fed Rolls Out the Red Carpet🎬 The Fed’s June Meeting Is Around the Corner
Mark your calendars: June 17–18 is when the Federal Reserve's Federal Open Market Committee (FOMC) convenes next. With the benchmark interest rate ECONOMICS:USINTR currently holding steady at 4.25% – 4.50%, investors and policymakers alike are keenl

Bullish Trigger Hit! Looking For Longs on the S&PLast time we spoke, I mentioned some key levels I wanted to see price drop to before considering a move to the upside. And what do you know — here we are.
In today’s video, I share an update on the trade idea and how we can position ourselves for the next big play.
Walk with me as I break down thi

See all editors' picks ideas
TrendMaster Pro 2.3 with Alerts
Hello friends,
A member of the community approached me and asked me how to write an indicator that would achieve a particular set of goals involving comprehensive trend analysis, risk management, and session-based trading controls. Here is one example method of how to create such a system:
Core

Support and Resistance Logistic Regression | Flux Charts💎 GENERAL OVERVIEW
Introducing our new Logistic Regression Support / Resistance indicator! This tool leverages advanced statistical modeling "Logistic Regressions" to identify and project key price levels where the market is likely to find support or resistance. For more information about the proc

Mandelbrot-Fibonacci Cascade Vortex (MFCV)Mandelbrot-Fibonacci Cascade Vortex (MFCV) - Where Chaos Theory Meets Sacred Geometry
A Revolutionary Synthesis of Fractal Mathematics and Golden Ratio Dynamics
What began as an exploration into Benoit Mandelbrot's fractal market hypothesis and the mysterious appearance of Fibonacci sequences i

EMD Trend [InvestorUnknown]EMD Trend is a dynamic trend-following indicator that utilizes Exponential Moving Deviation (EMD) to build adaptive channels around a selected moving average. Designed for traders who value responsive trend signals with built-in volatility sensitivity, this tool highlights directional bias, market

Bear Market Probability Model# Bear Market Probability Model: A Multi-Factor Risk Assessment Framework
The Bear Market Probability Model represents a comprehensive quantitative framework for assessing systemic market risk through the integration of 13 distinct risk factors across four analytical categories: macroeconomic indic

Range Filter [DW]This is an experimental study designed to filter out minor price action for a clearer view of trends.
Inspired by the QQE's volatility filter, this filter applies the process directly to price rather than to a smoothed RSI.
First, a smooth average price range is calculated for the basis of the fil

Delta Volume Columns Pro [LucF]█ OVERVIEW
This indicator displays volume delta information calculated with intrabar inspection on historical bars, and feed updates when running in realtime. It is designed to run in a pane and can display either stacked buy/sell volume columns or a signal line which can be calculated and dis

BERLIN CandlesA problem with Heikin Ashi is that while it gives you a great overview of overall direction, it is rarely possible to use it as a replacement for normal japanese
candlesticks. The reason for this is that actual price data is lost, since the candles are more akin to a moving average than a different

Support Resistance ChannelsHello All,
For Long time I was planning to make Support/Resistance Channels script, finally I had time and here it is.
How this script works?
- it finds and keeps Pivot Points
- when it found a new Pivot Point it clears older S/R channels then;
- for each pivot point it searches all pivot po

MathSpecialFunctionsConvolve1DLibrary "MathSpecialFunctionsConvolve1D"
Convolution is one of the most important mathematical operations used in signal processing. This simple mathematical operation pops up in many scientific and industrial applications, from its use in a billion-layer large CNN to simple image denoising.
___

See all indicators and strategies
News didn't load
Looks like that didn't go very well. Let's try again.
Community trends
WC: 29.58 Target: 1800-2400 MOASS: 47k-100K: Week Of 06/09Ok this is my last video on Gamestop
You will see less frequent posts going forward and they will be at the MACRO level and focused almost exclusively on the daily charts
Its been a ride covering this over the past year or so
True to my posting intention (I'm only here to help people trade better

OKLO can go locoPattern: Classic cup and handle formation. Handle forming as a bull flag — very bullish continuation setup.
Resistance: ~$57.78 — key neckline from prior highs. Needs strong close above this level for confirmation.
Volume: Declining during handle = textbook. Suggests controlled pullback. Watching

Palantir UpdateThere is a lot to unpack regarding Palantir based on what has transpired as of late. I have removed the possible smaller degree irregular abc pattern that I was tracking. If you draw fibs for what would be a sub-minuette wave i of (v), you see that our recent top was made right around the 1.236. Thi

NvdaRising wedge just like Qqq, Spy, and most of tech sectors...
Price should begin the decline down to 112.00 with a pit stop first at 128 or 200ma ..
I expect a dead cat bounce there back to 134 before the next leg down
As you can see here looking at the Chip sector SMH
You have a similar Risi

$MSTR ONCE IN A LIFETIMEMSTR working on an inside month
Looking for a breakout if we can clear the monthly HIGH last add on the 618 Fibonacci was A HUGE WINNER!
Will keep yall posted here all I ask is drop a LIKE for me!

$FSLR is in motion to $225NASDAQ:FSLR is in motion to $225🚂
- Breakout of downtrend
- Volume shelf launch
- Bullish H5_L indicator
- Bounced off support zone
- WR% is swinging to Red barrier

Inverted H&S on AMD BULLISH FOR MONDAY !!!! 150$USD JUNE END!!!Analysis of the Inverted Head and Shoulders
- Left Shoulder: The price first dipped, formed a trough, and then rebounded.
- Head: The stock dropped further, creating a lower trough than the left shoulder, followed by a recovery.
- Right Shoulder: A higher low formed, aligning with the left shoul

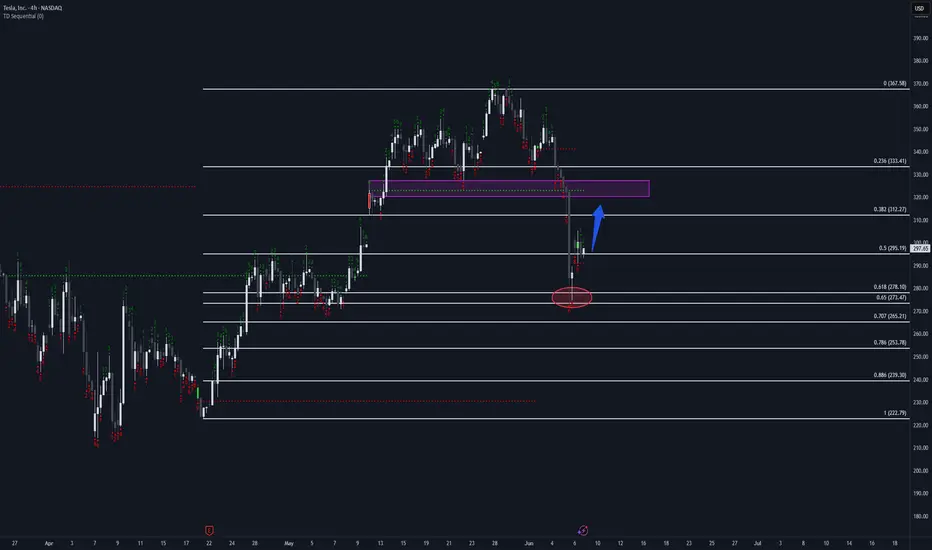
Tesla to re-test the 320 levelTesla bounced off the 0.618 fib level and wicked above (bullish).
We have a double red 9 on the 4 hour.
Looking for a recovery bounce to 315-320 level.
TSLA: Uptrend channel bounce, trading between 50 and 200-day SMAHey guys/gals!
So we all know that Tesla took a massive drop last week. It fell about 14%, and was down even 3% after hours at one point. I think we can all agree this crash wasn't technicals driven - it was clearly headline impacted. This was a clear black swan even t, and even in my case, nothin


See all stocks ideas
Today
GHMGraham Corporation
Actual
—
Estimate
0.18
USD
Today
RNWReNew Energy Global plc
Actual
0.06
USD
Estimate
0.06
USD
Today
MPAAMotorcar Parts of America, Inc.
Actual
—
Estimate
0.20
USD
Today
KIRKKirkland's, Inc.
Actual
—
Estimate
−0.47
USD
Today
DAKTDaktronics, Inc.
Actual
—
Estimate
0.15
USD
Today
PREPrenetics Global Limited
Actual
—
Estimate
−0.80
USD
Today
PODCPodcastOne, Inc.
Actual
—
Estimate
−0.04
USD
Today
VNCEVince Holding Corp.
Actual
—
Estimate
−0.48
USD
See more events
News didn't load
Looks like that didn't go very well. Let's try again.
Community trends
Bitcoin’s Reversal from Supports — Is the Correction Over? Bitcoin ( BINANCE:BTCUSDT ) moved as I expected in the previous idea , and it also reversed the decline I intended and started to rise from the Support zone($102,000-$107,120) , Support lines , and 50_SMA(Daily) .
Bitcoin is trading near the Resistance zone($104,380-$103,670) , Cumulative S

Can XRP Reach $10? A Perfect Storm of Fundamentals and TechnicalFrom a fundamental standpoint, the Ripple vs. SEC lawsuit continues to act as a major overhang on XRP’s long-term valuation. However, with the SEC’s 60-day deadline approaching (June 16), a favorable outcome for Ripple could inject fresh confidence into the market. This coincides with a broader macr


TradeCityPro | Bitcoin Daily Analysis #111👋 Welcome to TradeCity Pro!
Let’s take a look at Bitcoin and key crypto indicators. As usual in this analysis, I’ll review the futures triggers for the New York session.
⏳ 1-Hour Timeframe
As you can see in the 1-hour timeframe, none of our triggers were activated yesterday and Bitcoin has been ran

BTC Testing Major Resistance >>> Rejection Likely?Hi guys!
Did you see my last analysis about Btc? Let's break it down more!
Bitcoin is now testing a major resistance zone around $106.8K, where a descending trendline has already pushed the price down several times.
This area could act as a reversal point again. If BTC fails to break above, we mi

Internet Computer Protocol $81 Easy Target Yields 1,450% ProfitsIf you saw the Injective chart you know what happens after a correction, a classic ABC correction. What follows a correction is a bullish impulse.
A target of $81 gives us more than 1,450% profits potential for this pair, ICPUSDT (Internet Computer Protocol).
This is a project that was damaged by

Biggest Altcoin Season of this Bull Cycle is Coming! As you can see, there is a Massive Ascending Broadening Wedge forming on the #Bitcoin Dominance!
Currently dominance is located almost near the top of the wedge. More likely we will see its ascend up to 67% which will be marked as top before the dump.
The breakdown of this wedge will signal a beg

Bitcoin will continue to fall to support level in channelHello traders, I want share with you my opinion about Bitcoin. This chart shows how the price rebounded from the support line and started to grow. In a short time, it rose to the support level, which coincided with the buyer zone, and it even soon broke this level. Next, the price rose a little and

BITCOIN (BTCUSD): Waiting For BreakoutIt appears that ⚠️Bitcoin is gearing up for a bullish trend.
Analyzing the 4H time frame, I spotted a bullish flag pattern and a confrimed breakout of its upper boundary.
The final hurdle for buyers is the resistance level between 105,880 and 106,934 on the 4-hour chart.
A successful break and

Bitcoin: Break Out Or Fake Out Can Be Long.Bitcoin has adhered to my previous week's anticipated scenario almost exactly. While this may be a coincidence, I have called similar scenarios like this numerous times just see my previous articles, I left the illustration on the chart. From here, there are two scenarios to consider, one offering g

See all crypto ideas
News didn't load
Looks like that didn't go very well. Let's try again.
GOLD 1H CHART ROUTE MAP UPDATE & TRADING PLAN FOR THE WEEKHey Everyone,
Please see our updated 1h chart levels and targets for the coming week.
We are seeing price play between two weighted levels with a gap above at 3318 and a gap below at 3281. We will need to see ema5 cross and lock on either weighted level to determine the next range.
We will see le

GOLD → Correction to 3275FX:XAUUSD and medium-term outlook: Friday's strong unemployment data strengthened the dollar and triggered a sell-off in gold. Money is temporarily flowing out of the metal and into currencies and the stock market...
Technically, gold is still in a bullish phase on the global timeframe. Logica

THE KOG REPORT THE KOG REPORT:
In last weeks KOG Report we said we would wait for the market to open and look for a reaction on the Red box and based on that reaction we would decide where we wanted to go and how to trade it! We immediately opened with a bounce which gave us the opportunity to then get on with t

Gold: Easing China Tensions Could Weigh on XAUUSD Prices!!!Hey Traders, in the coming week we are monitoring XAUUSD for a selling opportunity around 3,340 zone, Gold was trading in an uptrend and currently is in a correction phase in which it is approaching the retrace area at 3,340 support and resistance area.
Trade safe, Joe.

GOLD (XAUUSD): Important Supports & Resistances for Next Week
Here is my latest structure analysis for Gold.
Vertical Structures
Vertical Support 1: Falling trend line
Vertical Support 2: Falling trend line
Horizontal Structures
Horizontal Support 1: 3231 - 3286 area
Horizontal Support 2: 3121 - 3177 area
Horizontal Resistance 1: 3372 - 3404 area
Horiz

Lingrid | GOLD Weekly Market Analysis: Consolidation ContinuesTVC:GOLD has developed a double top pattern, marking a significant shift from the previous consolidation phase. The recent rejection from the $3,400 resistance zone has created a bearish reversal structure that's now testing critical support levels. 4H chart reveals a clear double top formation wit

Gold will make impulse up from support line of triangle to 3430Hello traders, I want share with you my opinion about Gold. Some days ago, price entered to triangle, where it made an upward impulse at once to the resistance line, breaking the resistance level. But then price turned around and in a short time declined back, breaking the resistance level one more

HelenP. I Gold may break support level and continue to move downHi folks today I'm prepared for you Gold analytics. Observing this chart, we can see how the price reached support 2, which coincided with the support zone and tried to break it, but failed and dropped below. Then Gold turned around and made an impulse up, broke firstly 3125 level first and then rea

XAUUSD H4 Outlook – CHoCH Confirmed & Discount Pullback in Motio👋 Hey traders!
Here’s your fresh H4 XAUUSD Outlook for June 9, 2025 — real-time structure, sniper zones, and bias clarity, right where price is sitting. Let’s dive in 👇
📍 Bias: Bearish short-term → clean CHoCH & liquidity sweep, targeting discount retracement
🔹 1. 🔍 H4 Structure Summary
CHoCH (Lowe

XAUUSDMy current thought process towards this trade: Overall, the structure is bullish, which means I am looking for buying opportunities—but not in this case. I see a potential sell-off, and the structure may be shifting direction. I strongly believe in that idea, but I can only wait and see.The thing ab

See all futures ideas
News didn't load
Looks like that didn't go very well. Let's try again.
EURUSDHello Traders! 👋
What are your thoughts on EURUSD?
EURUSD remains below a key resistance zone, and at this stage, it does not appear to have enough momentum to break through.
We are watching for potential sell setups around this area.
As long as there is no daily candle close above the resistance,

#GBPJPY: 600+ Pips Swing Move, JPY To Drop! GBPJPY has successfully rejected the area previously identified in our analysis of GJ. We had anticipated a price rejection and reversal with a strong bullish impulse, which has materialised. Following the positive candle close on Friday, we anticipate a continuation of the bullish trend and potenti

EURO - Price will strart to grow and exit from wedge patternHi guys, this is my overview for EURUSD, feel free to check it and write your feedback in comments👊
Price entered to wedge pattern and at once dropped below $1.1455 level, breaking it and then some time traded below.
It continued to decline and in a short time reached $1.1220 level and broke it, a

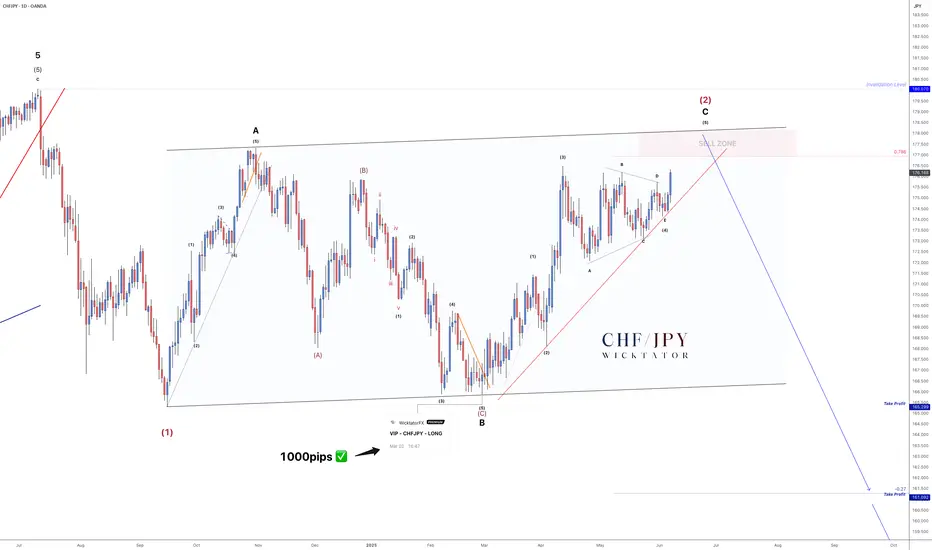
CHFJPY - 1700 Pip Reversal Incoming!The last time we looked at CHFJPY was back in October 2024, where we forecasted a large ABC correction. Fast forward to now - that correction is nearly complete!
We're currently in the 5th subwave of wave C, and everything points toward a massive drop setting up. We expect a move of at least 1500 p
USDJPY Pending Short at 146.32In this idea, I have plotted all the necessary information on the chart itself. But allow me to point them out in words:
1. A resistance zone drawn with a rectangle that shows 5 red down arrows, out of which 4 are historical price rejection points and the last one is an expected rejection point at t

EURUSD has follow the ascending channel bullish from support FX:EURUSD Analysis – 1H Time Frame
EUR/USD is currently respecting an ascending channel and showing strong bullish momentum from the key demand zone at 1.13900.
🎯 Technical Targets:
1st Target: 1.14600
2nd Target: 1.15000
The price action confirms buyer interest and continued upside potential

NZDUSD - Time to buyWhen the market opens and we have a clear longing opportunity to get long on NZDUSD
We have an inducement level to the left and already have a sign of strength to the upside.

AUDUSD DistributionI will look for a valid entry from this 15m supply to enter a short to at least the range low of this model 1 distribution. This would then be a extended model 1 going over into a model 2 with a good return to zone so let's see. A entry would already be valid but i will either wait or skip for a bet


USDCAD WILL DELIVER BY FIREThe USD/CAD trended lower in a volatile manner this week, declining 0.29% on a weekly basis, reflecting the relative resilience of the Canadian dollar supported by the Bank of Canada's (BoC) policy and economic data. The BoC maintained its interest rate at 2.75%, in line with market expectations. Th

See all forex ideas
| EUR | USD | GBP | JPY | CHF | AUD | CAD | ||
|---|---|---|---|---|---|---|---|---|
| EUR | - | - | - | - | - | - | - | |
| USD | - | - | - | - | - | - | - | |
| GBP | - | - | - | - | - | - | - | |
| JPY | - | - | - | - | - | - | - | |
| CHF | - | - | - | - | - | - | - | |
| AUD | - | - | - | - | - | - | - | |
| CNY | - | - | - | - | - | - | - | |
| CAD | - | - | - | - | - | - | - |
News didn't load
Looks like that didn't go very well. Let's try again.
Trade directly on the supercharts through our supported, fully-verified and user-reviewed brokers.


