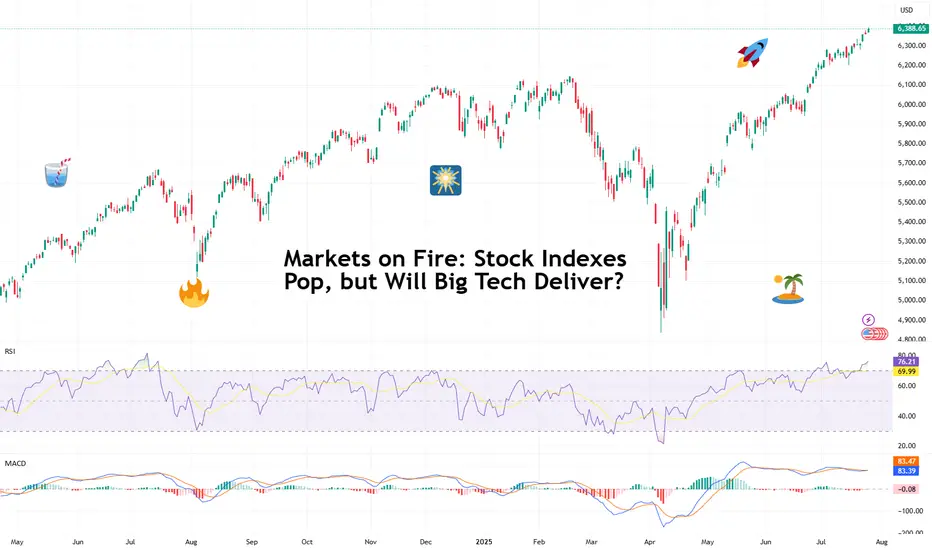
Markets on Fire: Stock Indexes Pop, but Will Big Tech Deliver?S&P 500 and Nasdaq set records. Now it's up to big tech to justify that.
Talk about forward-looking valuation. Tech companies’ valuations are largely based on future potential rather than current performance. And that’s what we’re seeing right now getting priced in across the big indexes.
You’d

The best trades require research, then commitment.
Get started for free$0 forever, no credit card needed

Scott "Kidd" PoteetThe unlikely astronaut

Where the world does markets
Join 100 million traders and investors taking the future into their own hands.
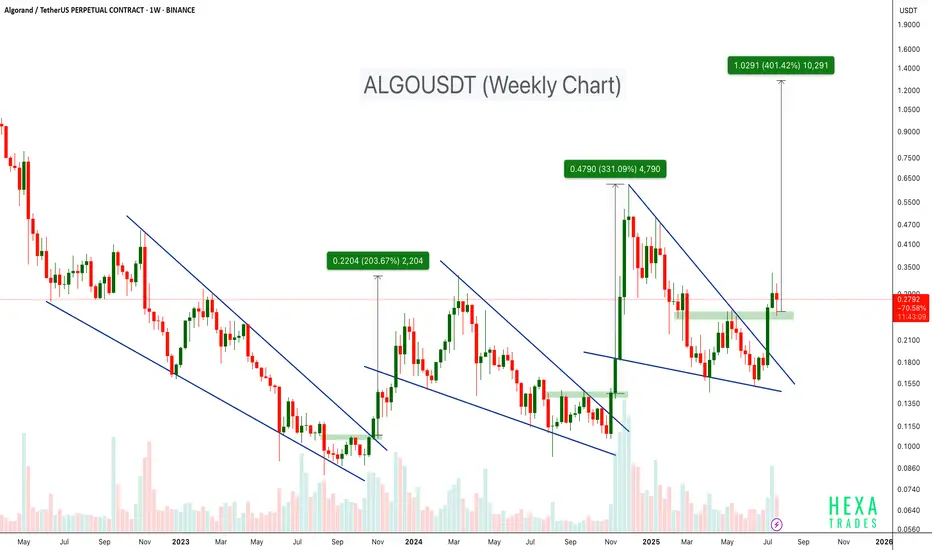
ALGO Breaks Out of Falling Wedge – 400% Target Ahead?BINANCE:ALGOUSDT has consistently followed a bullish pattern on the weekly timeframe. Each major rally has been preceded by a falling wedge breakout, as shown by the three highlighted instances on the chart.
- First breakout: ~200%+ move
- Second breakout: ~300%+ move
- Current breakout projection
Retro Editors' picks 2021Going further in our retro EP selection , we present to you a collection of additional scripts from 2021 that have earned a spot in our Editors' picks. These retrospective selections reflect our continued commitment to honoring outstanding contributions in our community, regardless of when they wer

Retro Editors' picks 2022Going further in our retro EP selection , we present to you the third collection of additional scripts that have earned a spot in our Editors' picks, now from 2022.
These retrospective selections reflect our continued commitment to honoring outstanding contributions in our community, regardless o
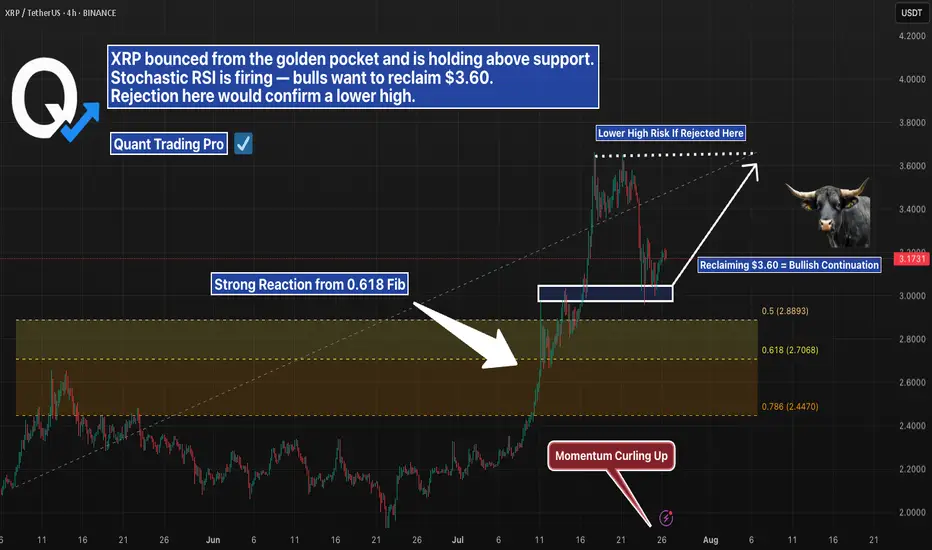
XRP 4H – Golden Pocket Bounce, But Will Bulls Reclaim $3.60?XRP pulled back cleanly into the golden pocket (0.618 Fib) after a strong rally — and buyers stepped in with force. Momentum flipped quickly, and Stochastic RSI is curling up with bullish intent.
Now price is holding above short-term support, but faces a key challenge:
→ $3.60 marks the prior high
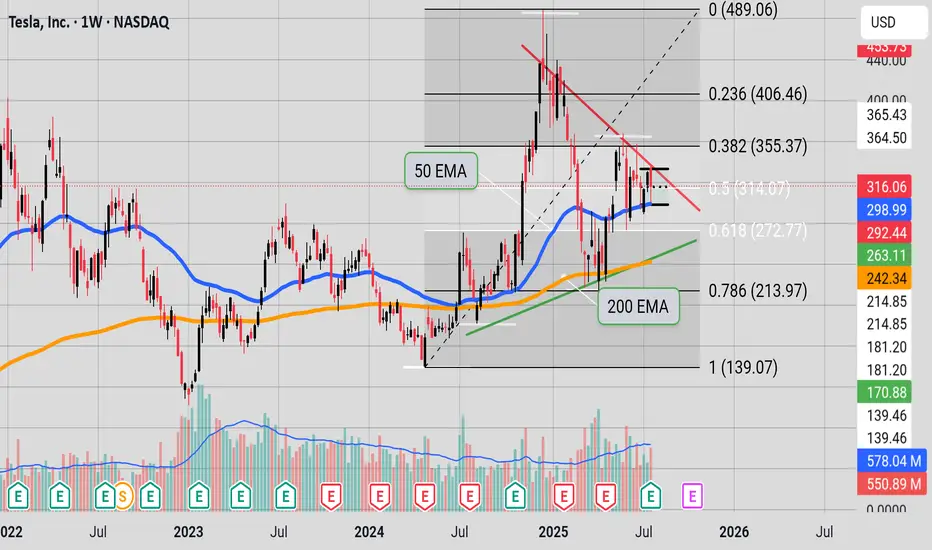
Inflection point"Tesla is at a binary point on the chart. The stock is wedged tightly between the red, downward-sloping resistance line (upper boundary) and the green, upward-sloping support line (lower boundary)—the classic apex of an asymmetrical triangle.
At this stage:
A breakout above the red resistance woul
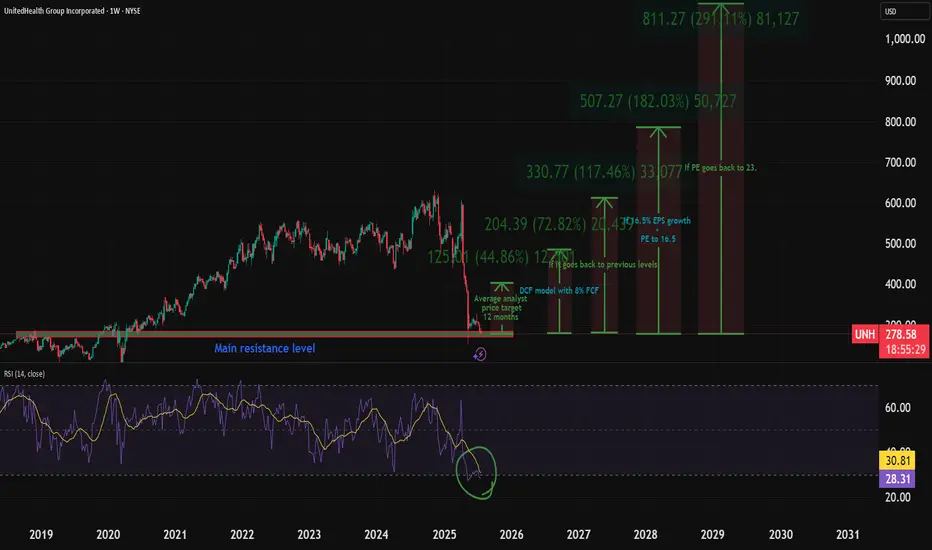
My UNH Thesis: Betting on a Healthcare Giant's Come BackThe healthcare sector has been in decline, which creates interesting opportunities. I recently talked about a few pharma plays - Eli Lilly, Novo Nordisk, and Pfizer.
Here's why I'm investing in NYSE:UNH :
UnitedHealth Group (UNH) has tanked ~50% in the past year, but the July 29 (VERY SOON) ea
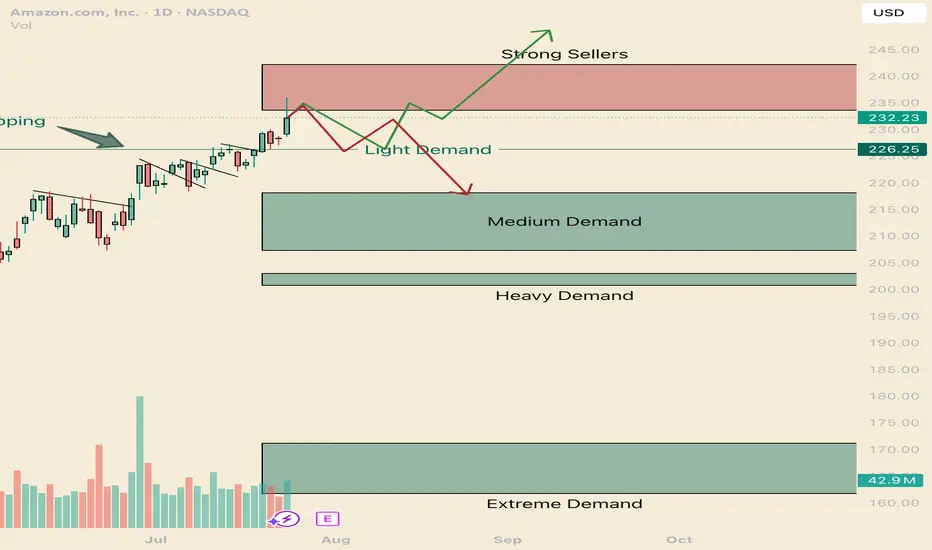
How to navigate the Amazonian Squeeze. AMZNHello I am the Cafe Trader.
This week has been a deep dive on the MAG 7 and today AMZN is up next.
We are going to look at long term and short term opportunities.
We are near the All Time Highs, with one final Seller to get through before making the break.
Today we tested to see if those sellers
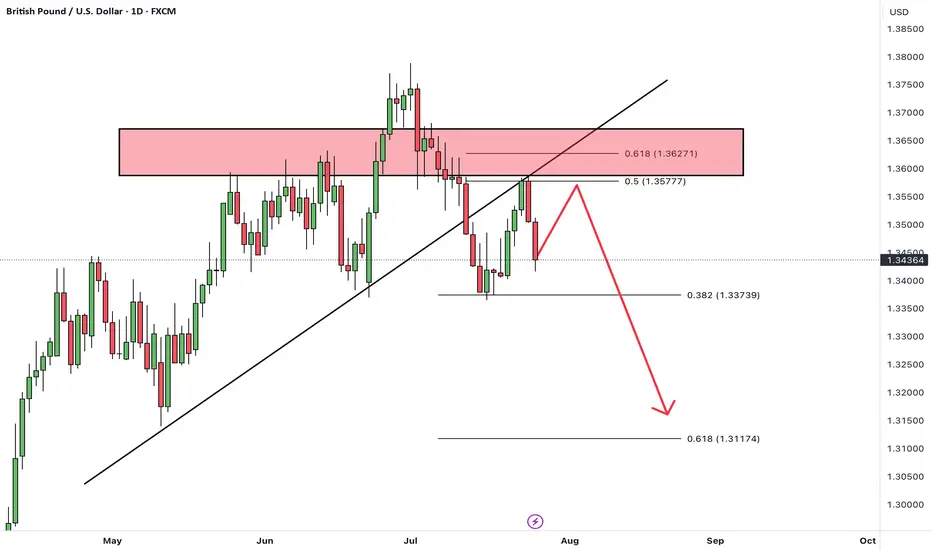
GBPUSD Traders Beware: A Major Drop Could Be ComingThe classic rule says what doesn’t go up must come down. After a failed breakout at 1.3439, GBPUSD is struggling. With longs sitting on big gains from January’s low, a drop toward 1.3361 or even lower looks likely. Watch this key level now.
This content is not directed to residents of the EU or

TradingView Show: Trade Ideas You Can't Miss with TradeStationJoin us for a timely TradingView live stream with David Russell, Head of Global Market Strategy at TradeStation, as we break down the latest rebound in the markets and what it could mean for traders and investors. In this session, we’ll dive into:
- New sectors to watch, like homebuilders
- Prio

See all editors' picks ideas
Intrabar Efficiency Ratio█ OVERVIEW
This indicator displays a directional variant of Perry Kaufman's Efficiency Ratio, designed to gauge the "efficiency" of intrabar price movement by comparing the sum of movements of the lower timeframe bars composing a chart bar with the respective bar's movement on an average ba

Strategy█ OVERVIEW
This library is a Pine Script™ programmer’s tool containing a variety of strategy-related functions to assist in calculations like profit and loss, stop losses and limits. It also includes several useful functions one can use to convert between units in ticks, price, currency or a per

Signs of the Times [LucF]█ OVERVIEW
This oscillator calculates the directional strength of bars using a primitive weighing mechanism based on a small number of what I consider to be fundamental properties of a bar. It does not consider the amplitude of price movements, so can be used as a complement to momentum-based osc

Estimated Time At Price [Kioseff Trading]Hello!
This script uses the same formula as the recently released "Volume Delta" script to ascertain lower timeframe values.
Instead, this script looks to estimate the approximate time spent at price blocks; all time estimates are in minute.second format.
The image above shows functionality.

Volume Profile, Pivot Anchored by DGTVolume Profile (also known as Price by Volume ) is an charting study that displays trading activity over a specified time period at specific price levels. It is plotted as a horizontal histogram on the finacial isntrumnet's chart that highlights the trader's interest at specific price levels. Specif

Fair Value MSThis indicator introduces rigid rules to familiar concepts to better capture and visualize Market Structure and Areas of Support and Resistance in a way that is both rule-based and reactive to market movements.
Typical "Market Structure" or "Zig-Zag" methods determine swing points based on fixed t

TextLibrary "Text"
library to format text in different fonts or cases plus a sort function.
🔸 Credits and Usage
This library is inspired by the work of three authors (in chronological order of publication date):
Unicode font function - JD - Duyck
UnicodeReplacementFunction - wlhm

Risk Distribution HistogramStatistical risk visualization and analysis tool for any ticker 📊
The Risk Distribution Histogram visualizes the statistical distribution of different risk metrics for any financial instrument. It converts risk data into histograms with quartile-based color coding, so that traders can understand th

Crowding model ║ BullVision🔬 Overview
The Crypto Crowding Model Pro is a sophisticated analytical tool designed to visualize and quantify market conditions across multiple cryptocurrencies. By leveraging Relative Strength Index (RSI) and Z-score calculations, this indicator provides traders with an intuitive and detailed sn

Dynamic Gap Probability ToolDynamic Gap Probability Tool measures the percentage gap between price and a chosen moving average, then analyzes your chart history to estimate the likelihood of the next candle moving up or down. It dynamically adjusts its sample size to ensure statistical robustness while focusing on the exact de

See all indicators and strategies
News didn't load
Looks like that didn't go very well. Let's try again.
Community trends
My UNH Thesis: Betting on a Healthcare Giant's Come BackThe healthcare sector has been in decline, which creates interesting opportunities. I recently talked about a few pharma plays - Eli Lilly, Novo Nordisk, and Pfizer.
Here's why I'm investing in NYSE:UNH :
UnitedHealth Group (UNH) has tanked ~50% in the past year, but the July 29 (VERY SOON) ea
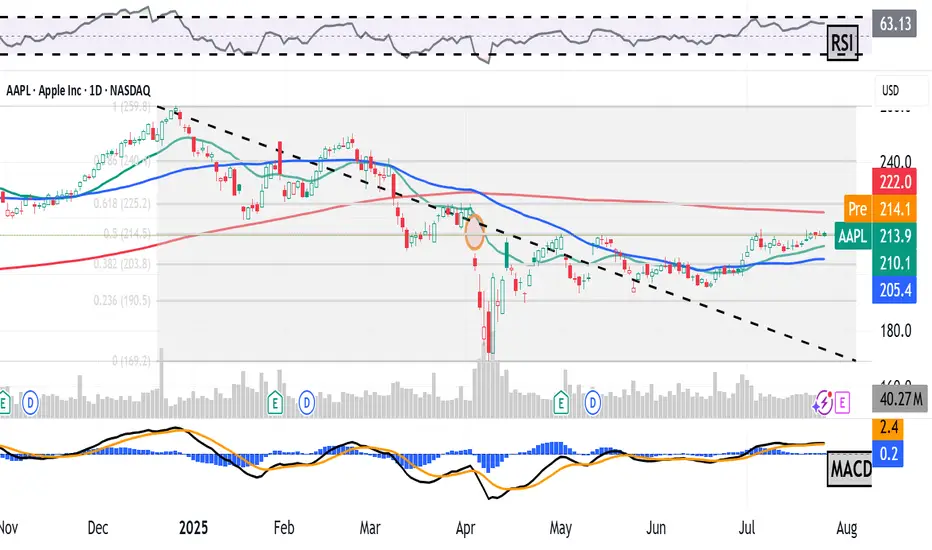
AAPL BUY 1st target $223AAPL is forming a wedge and been lagging for 2 years. I was expecting $182 but we never saw that level, after weeks of $200 range consolidation it's clear this is basing, first target of resistance is $223 then we could be off to the races. I would expect to see this as soon as next week provided

Tesla Stock in Bearish Trend - Further Downside ExpectedTesla Stock in Bearish Trend - Further Downside Expected
Tesla's (TSLA) stock price continues to display a clear bearish trend structure, characterized by the formation of consistent lower lows and lower highs on the price chart. This technical pattern suggests sustained selling pressure and indica

Incoming 40% correction for FacebookOn the above 10 day chart price action has rallied 500% since October 2022. It is somewhat unfortunate to see so many long ideas at the moment.
Motley Fool August 8th:
“Here's how Meta could achieve a $2 trillion valuation within three years, and if it does, investors who buy the stock today could

SMCI WEEKLY CALL SETUP (07/28/25)
### 🔹 SMCI WEEKLY CALL SETUP (07/28/25)
**Bullish Flow + Strong RSI = 🚀 Call Opportunity at \$62**
---
### 📊 TECHNICAL SNAPSHOT
* **RSI (Daily + Weekly):** ✅ Above 55 — clear bullish strength
* **Weekly Close:** 🔼 Broke prior highs — momentum continuation likely
* **Volume Ratio:** Slightly we

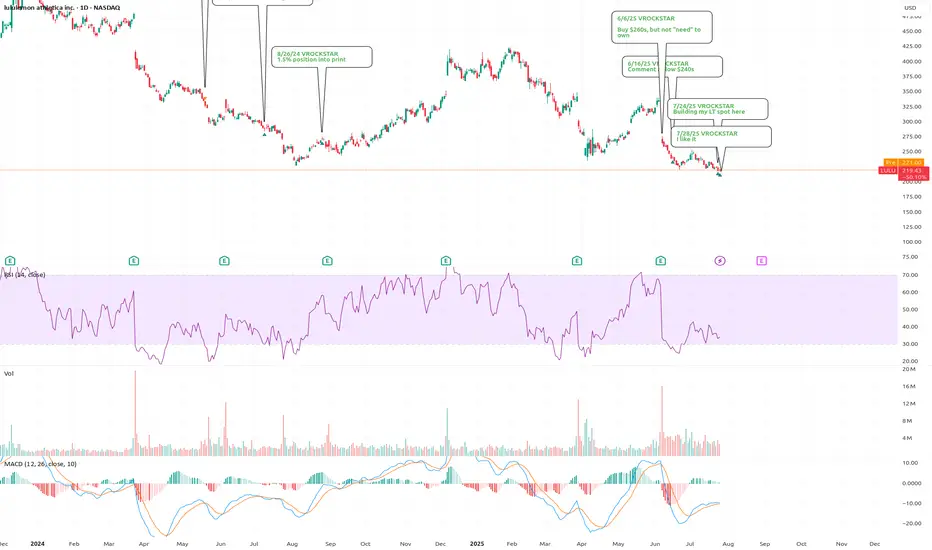
7/28/25 - $lulu - and goodbye7/28/25 :: VROCKSTAR :: NASDAQ:LULU
I like it
Apparently i can't post my thoughts anymore w/o it being flagged. so what's the point?
And i don't play stupid games and win stupid prizes... so goodbye public notes. ez decision.
Also... purely technical analysis will go the way of AI. So beware. Lea
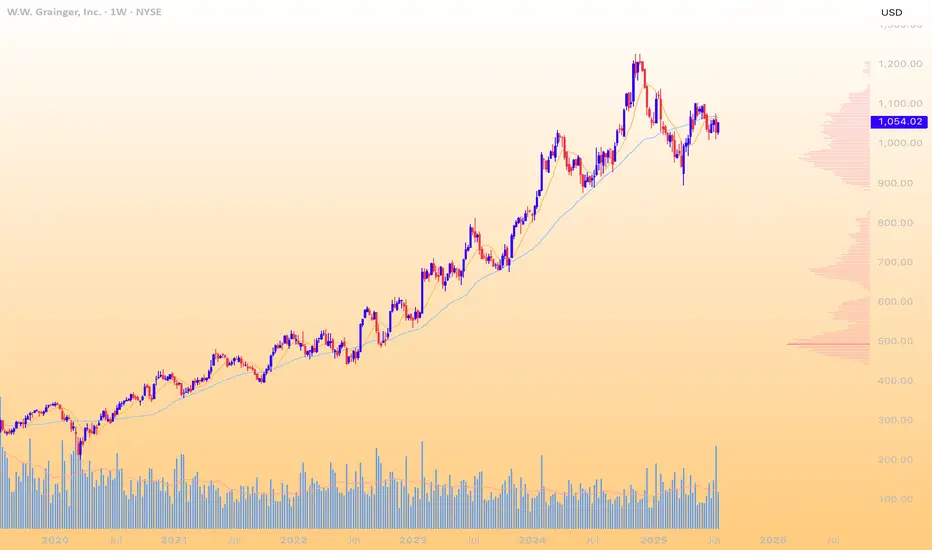
GWW stage 3 distribution/stage 4 declineGWW is showing a possible entry of a stage 3 distribution range, and into a stage 4 decline. The price recently busted below the 50 and 200 smas, and with large volume, has failed to recover above them. The 50 and 200 moving averages have begun to turn over. GWW has demonstrated poor relative streng
Long Trade Setup on $SMCI!📈
Entry: $54.46
Stop Loss: $53.97
Target: $56.39
Pattern: Rising Wedge Breakout
Risk-Reward: ~2R
Key Zone: $55.41 (resistance/rejection level to watch)

Apple Is Down YTD Ahead of Earnings. What Does Its Chart Say?Apple NASDAQ:AAPL will report earnings Thursday at a time when the tech giant has been struggling more than most other "Magnificent Seven" stocks or higher-end, AI-focused companies. What does fundamental and technical analysis say about AAPL heading into the report?
Let's see:
Apple's Fundamen
TSLA at the Edge of Reversal or Rally? Key Setup Ahead. Jul 28🔍 Technical Analysis (1H + 15M Confluence)
* Market Structure:
After a steep drop from $334, TSLA has shown a recovery off the $300.41 low. The 1H chart shows a bounce forming higher lows, with price now consolidating around $317–$318.
* SMC Insight (15M):
The bullish BOS and CHoCH signal a structur

See all stocks ideas
Jul 28
PROVProvident Financial Holdings, Inc.
Actual
0.24
USD
Estimate
0.32
USD
Jul 28
RVTYRevvity, Inc.
Actual
1.18
USD
Estimate
1.14
USD
Jul 28
BOHBank of Hawaii Corporation
Actual
1.06
USD
Estimate
1.06
USD
Jul 28
ARLPAlliance Resource Partners, L.P.
Actual
0.46
USD
Estimate
0.61
USD
Jul 28
ALRSAlerus Financial Corporation
Actual
0.72
USD
Estimate
0.55
USD
Jul 28
BWFGBankwell Financial Group, Inc.
Actual
1.15
USD
Estimate
0.84
USD
Jul 28
EPDEnterprise Products Partners L.P.
Actual
0.66
USD
Estimate
0.64
USD
Jul 28
BCBPBCB Bancorp, Inc. (NJ)
Actual
0.18
USD
Estimate
0.18
USD
See more events
News didn't load
Looks like that didn't go very well. Let's try again.
Community trends
BITCOIN - Price can correct to support area and then start riseHi guys, this is my overview for BTCUSD, feel free to check it and write your feedback in comments👊
For a significant period, the price of Bitcoin was trading upwards within the confines of a rising channel.
Strong buying pressure led to a breakout above the channel's upper boundary, signaling an

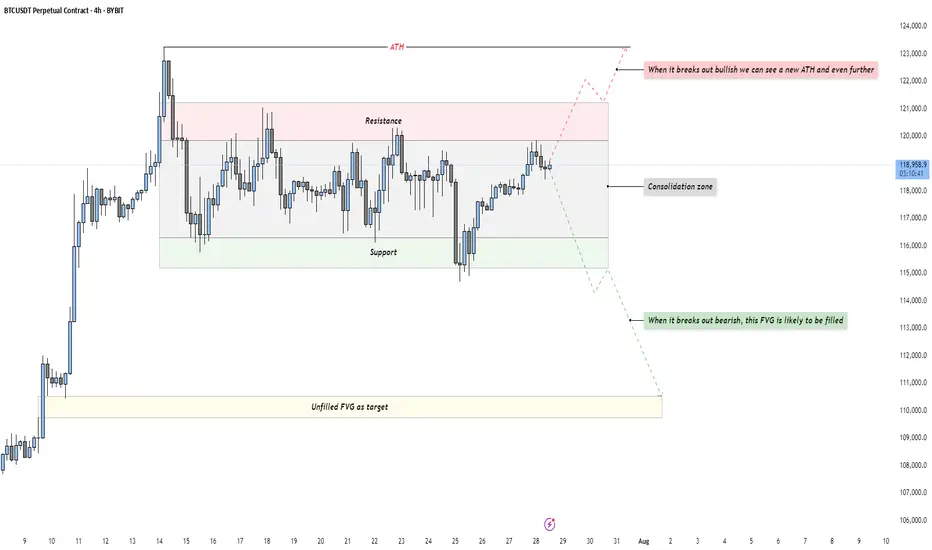
BTC - Bulls vs Bears: who will win?Market Context
Bitcoin is trading in a tight consolidation just below its all-time high after a strong impulsive rally. This phase represents a balance of power between buyers and sellers, with neither side able to take control yet. Such a pause in momentum at this key level often builds pressure f
6/ Altseason: Live - Is this really the Altseason?12day Result I know this is the exact question you're asking yourselves as you look at your portfolios. "What altseason? Everything is flat."
Maybe I was wrong two weeks ago when I said it had already started. But, as they say, the result speaks for itself.
12 days ago, as part of the Altseason Live challen

Bitcoin is getting Ready for 143K$ nowMajor red resistance trendline is now broken also last week the retest is completed now price is range for a while for new week to start and fresh volume and buys that make path easier to reach above 140K$.
Get ready and take a look at important zones at chart and possible scenarios which are all m

ALGO Breaks Out of Falling Wedge – 400% Target Ahead?BINANCE:ALGOUSDT has consistently followed a bullish pattern on the weekly timeframe. Each major rally has been preceded by a falling wedge breakout, as shown by the three highlighted instances on the chart.
- First breakout: ~200%+ move
- Second breakout: ~300%+ move
- Current breakout projection
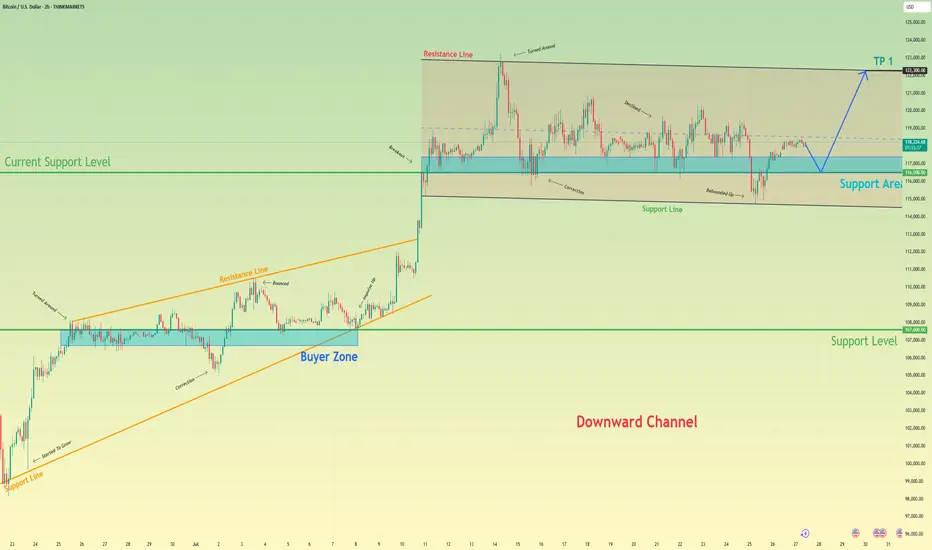
Bitcoin will rebound up from support area to resistance lineHello traders, I want share with you my opinion about Bitcoin. After a strong upward trend that originated from the buyer zone and evolved through an upward wedge, bitcoin executed a decisive breakout, shifting the market into a new, higher-value market phase. This powerful move has since led to an
SUI new trend started!SUI / USDT
Price broke out after long accumulation range with good volume
Looks like a new bullish trend has started

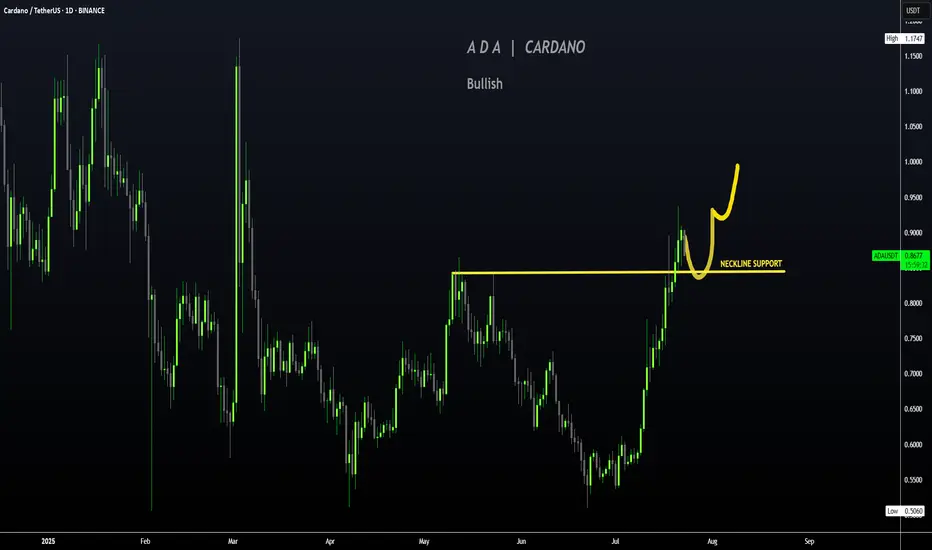
CARDANO | ADA Creeping UP to $1Cardano has made a big move in recent weeks, boasting a 77% increase.
If you were lucky enough to buy in around 30 or 40c, this may be a great TP zone:
Looking at the Technical Indicator (moving averages), we can see the price makes its parabolic increases ABOVE - which is exactly where we are c
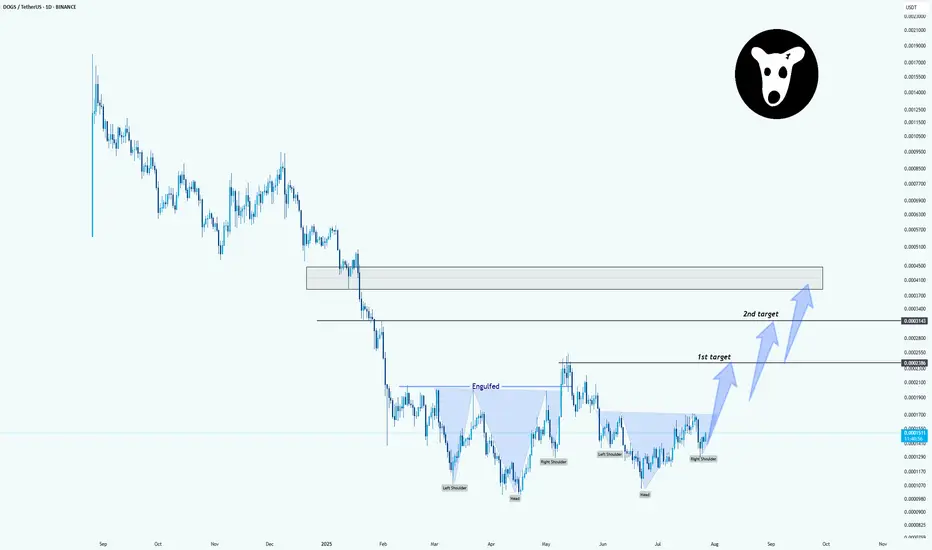
DOGSUSDT: Inverse Head & Shoulders Pattern in PlayHello.
The chart clearly shows an inverse head and shoulders formation. Price has now formed:
Left Shoulder
Head
Right Shoulder (recently completed)
The neckline was engulfed after a strong move, which adds confidence to the breakout potential. If the price continues to hold above the right shoul
BITCOIN → Correction within a downward channel. 112K or 125K?BINANCE:BTCUSDT is consolidating. However, a local downward trading range is forming relative to the current setup. What is the probability of a correction continuing to 112K or growth to 125K?
Daily structure: a local correctional channel within a global bullish trend. We have cascading resis

See all crypto ideas
News didn't load
Looks like that didn't go very well. Let's try again.
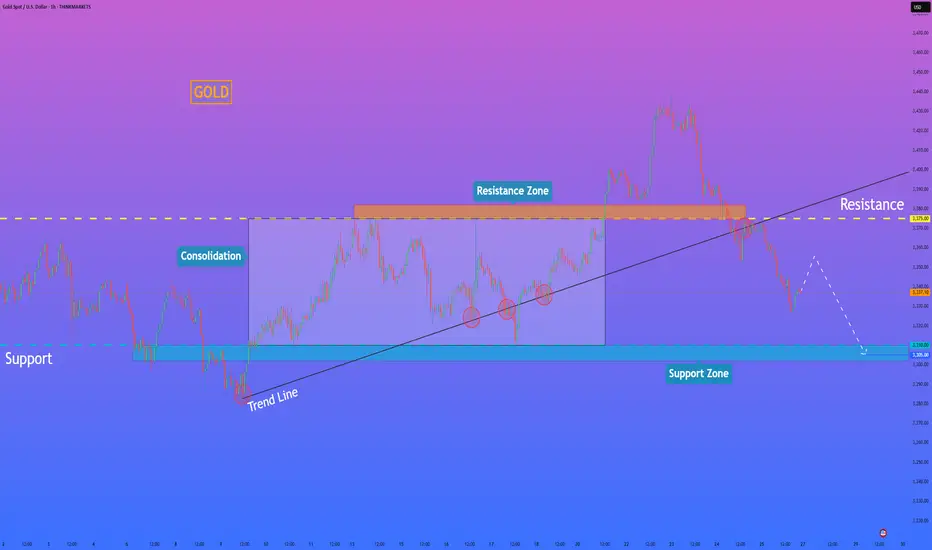
HelenP. I Gold can continue to decline to support zoneHi folks today I'm prepared for you Gold analytics. If we look at the price chart, we can observe a significant shift in the market structure, highlighted by the recent decisive break of a long-standing ascending trend line. This event suggests that the previous bullish momentum has been exhausted a
Lingrid | GOLD Weekly Market Outlook: Resistance Zone RejectionOANDA:XAUUSD markets have encountered significant resistance at the $3,450 level, resulting in a notable rejection and subsequent pullback toward support zones. The precious metal is now testing critical technical levels that will determine whether the broader bullish momentum can be sustained or i

The correction is quite surprise. What direction for GOLD price?✏️Quite surprised with the adjustment of gold at the end of the previous trading week. The rising price channel is still holding around the lower border of the price channel around 3316. A liquidity sweep and candle wick removal in this area is considered a good buying opportunity.
If h1 closes bel
Hellena | GOLD (4H): LONG to resistance area of 3440 (Wave V).As you can see, everything turned out to be more complicated than I had previously thought. We are dealing with a complex correction and a diagonal. I believe that the “ABCDE” waves, which make up the corrective wave “4”, are completing their levels, and I continue to expect the upward movement to c

Gold 8H Bullish Reversal Setup After Channel Break. Gold/USD 8H Chart Analysis:
Price has broken below an ascending channel, indicating potential short-term weakness. However, a bullish reversal setup is marked, with a suggested buy zone near current levels (~3339), targeting the 3428–3459 USD range. Stop loss placed below 3310 for risk management.

GOLD 1H CHART ROUTE MAP UPDATE & TRADING PLAN FOR THE WEEKHey Everyone,
Please see our updated 1h chart levels and targets for the coming week.
We are seeing price play between two weighted levels with a gap above at 3348 and a gap below at 3328 . We will need to see ema5 cross and lock on either weighted level to determine the next range.
We will see l

Gold Showing Signs of Reversal After Hitting Key ResistanceHello Guys.
Gold has reached a major resistance zone around 3439–3425, which has already acted as a strong ceiling in the past. The price tapped into this area again, forming a clear divergence, and failed to break higher.
Here’s what stands out:
Divergence signals a weakening bullish momentum

GOLD → Retest of trend support. Consolidation...GOLD is consolidating below the previously broken trend support. On Sunday, Trump announced a trade deal with the EU, which is putting pressure on the market along with the rising dollar...
Gold rebounded from support at $3310 after a week-long low, interrupting a three-day decline amid profit-ta

Gold : Holding Ground Below 3345 Amid USD SurgeGold : Holding Ground Below 3345 Amid USD Surge
Gold's upward potential from Friday appears limited by the 3345 level—a narrow but firm resistance zone. As long as price fails to break above it, this zone has a high importance.
If gold holds below 3345, the probability of further downside increas

Title: WTI Crude Oil 2H – Bearish Rejection Setup with Downside The updated chart maintains the bearish channel structure, with price continuing to respect lower highs and lower lows.
Current Price: $66.413
Bearish Outlook Maintained:
Price has recently tested the mid-range of the descending channel.
A minor bullish retracement is anticipated into the green

See all futures ideas
News didn't load
Looks like that didn't go very well. Let's try again.
GBPCAD At Support - High probability reversalGBPCAD descended with strength, and has now reached a strong support zone.
Price now hovers above and this zone and is a great indication to use for possible reversal move, that could send price into the 1.86100 level.
But if price breaks below support with momentum, then I’ll back off this bullish

GBP/CAD - H4 - Bearish Flag (26.07.2025)The GBP/CAD Pair on the H4 timeframe presents a Potential Selling Opportunity due to a recent Formation of a Bearish Flag Pattern. This suggests a shift in momentum towards the downside in the coming Days.
Possible Short Trade:
Entry: Consider Entering A Short Position around Trendline Of The P

GBPUSDHello Traders! 👋
What are your thoughts on GBPUSD?
GBP/USD has broken below a trendline and has completed a retest (pullback) to the broken level.
The pair is now positioned for a potential downward move.
After some short-term consolidation, we expect price to drop at least toward the next identif
AUDCAD I Daily CLS I Model 2 I HTF DOL TargetYo Market Warriors ⚔️
Fresh Crypto Analysis— if you’ve been riding with me, you already know:
🎯My system is 100% mechanical. No emotions. No trend lines. No subjective guessing. Working all timeframes. Just precision, structure, and sniper entries.
🧠 What’s CLS?
It’s the real smart money. The i

EURO - Price can continue to move up inside rising channelHi guys, this is my overview for EURUSD, feel free to check it and write your feedback in comments👊
The price action of price reversed its course after breaking out from a previous falling channel formation.
Since then, the asset has been trading within the clear boundaries of a well-defined risin

28.07.25 Morning ForecastPairs on Watch -
FX:EURCAD
FX:GBPUSD
OANDA:XAUUSD
FX:EURUSD
A short overview of the instruments I am looking at for today, multi-timeframe analysis down to what I will be looking at for an entry. Enjoy!

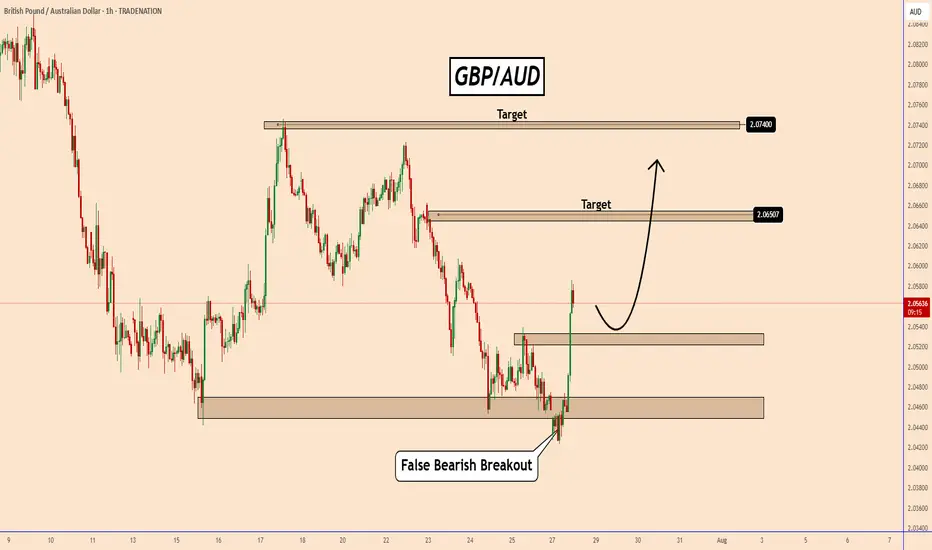
GBPAUD transformed its chart quickly from bearish to bullish!GBPAUD transformed its chart quickly from bearish to bullish!
During the opening of the Market today, GBPAUD created a clear bearish breakout structure and later canceled that breakout.
From the chart we can see a false bearish breakout and GBPAUD is already positioned for a bullish move.
The b
USDJPY Potential UpsidesHey Traders, in today's trading session we are monitoring USDJPY for a buying opportunity around 147.800 zone, USDJPY is trading in an uptrend and currently is in a correction phase in which it is approaching the trend at 147.800 support and resistance area.
Trade safe, Joe.

Lingrid | EURUSD Drops from 1.18000 RESISTANCE. Possible ShortFX:EURUSD is showing strong rejection at the resistance zone near 1.1790 after multiple fake breaks and failed attempts to sustain above the key level. Price has now broken below the mid-range and is forming a bearish rejection pattern right at the edge of the breakout area. With bearish momentum

EURUSD: Buyers Like the New Trade Deals With The US!Welcome back to the Weekly Forex Forecast for the week of July 28 - Aug 1st.
In this video, we will analyze the following FX market:
EURUSD
Buyers reacting positively to the announcements of trade deals with the US.
Longs are the play until we see a bearish break of significant structure.
FOMC an

See all forex ideas
| - | - | - | - | - | - | - | ||
| - | - | - | - | - | - | - | ||
| - | - | - | - | - | - | - | ||
| - | - | - | - | - | - | - | ||
| - | - | - | - | - | - | - | ||
| - | - | - | - | - | - | - | ||
| - | - | - | - | - | - | - | ||
| - | - | - | - | - | - | - |
News didn't load
Looks like that didn't go very well. Let's try again.
Trade directly on the supercharts through our supported, fully-verified and user-reviewed brokers.


