Silver surge has more bullish upsideSilver is breaking out. Its strength is no accident. The US is running a structural deficit north of 6% of GDP in a full-employment economy. The bond market has absorbed the pain so far, but pressure is building. Investors are starting to look for insurance. Silver is one of the cleanest ways to pl

The best trades require research, then commitment.
Get started for free$0 forever, no credit card needed

Scott "Kidd" PoteetThe unlikely astronaut

Where the world does markets
Join 100 million traders and investors taking the future into their own hands.

Soaring platinum breaks a 3 year high at $1,152.50/ozChina, the world’s largest consumer of platinum, imported its highest amount in a year last month. Retail investment demand (bars and coins) in China more than doubled, overtaking North America as the top market for platinum investment.
Analysts at Bloomberg Intelligence predict that global platinum

Elon Musk vs Trump: Who you betting on?Elon Musk and Donald Trump have recently had a public falling-out, with their feud playing out on social media and in political circles.
The dispute seems to have started over Trump's new budget bill, which Musk has criticized for increasing the national debt. Trump, in turn, accused Musk of being

OptionsMastery: Inverse head and shoulders on UAL! 🔉Sound on!🔉
📣Make sure to watch fullscreen!📣
Thank you as always for watching my videos. I hope that you learned something very educational! Please feel free to like, share, and comment on this post. Remember only risk what you are willing to lose. Trading is very risky but it can change your life!

The MSCI World index sets a new all-time record!The MSCI World stock market index set a new all-time record during the trading session of Monday June 2, wiping out the entire stock market shock of February/March, which saw the global equity market lose 20%. This technical signal still needs to be confirmed at the end of the week at the next weekl

USDJPY forms textbook head and shoulders patternOur last bearish call on USDJPY played out perfectly. Now, a new setup is forming. With US ISM data showing contraction and stock markets under pressure, the dollar-yen could be next to drop. Watch as we break down the textbook head and shoulders pattern and the levels to watch for a potential 600+

Do bulls have enough steam to drive gold higher?A lot of things to consider this week, a lot of data and geopolitical tensions. Will the economic uncertainty and potential bad US jobs data drive TVC:GOLD higher? Let's dig in.
FX_IDC:XAUUSD
Let us know what you think in the comments below.
Thank you.
77.3% of retail investor accounts lose

Bull market scenario LITECOINAt this period, I'm speaking about LITECOIN, which currently has one of the strongest bull-looking charts on cryptocurrency!
We may see the price testing Fibo's higher levels very soon...
A bull market may begin, so I recommend focusing on higher price markings...
On another market, like BTC, Ethe

TRVG - Basic Analysis can lead to great trade ideas!This is as simple as it gets. See a taper, be a taper!
Good trade opportunity incoming if we prove a breakout of red strong selling and we can make our way toward a HTF purple tapered selling and ultimately prove a HTF buying continuation in orange.
Happy Trading :)

Rate Cuts and Risky Bets: When the Fed Rolls Out the Red Carpet🎬 The Fed’s June Meeting Is Around the Corner
Mark your calendars: June 17–18 is when the Federal Reserve's Federal Open Market Committee (FOMC) convenes next. With the benchmark interest rate ECONOMICS:USINTR currently holding steady at 4.25% – 4.50%, investors and policymakers alike are keenl

See all editors' picks ideas
TrendMaster Pro 2.3 with Alerts
Hello friends,
A member of the community approached me and asked me how to write an indicator that would achieve a particular set of goals involving comprehensive trend analysis, risk management, and session-based trading controls. Here is one example method of how to create such a system:
Core

Support and Resistance Logistic Regression | Flux Charts💎 GENERAL OVERVIEW
Introducing our new Logistic Regression Support / Resistance indicator! This tool leverages advanced statistical modeling "Logistic Regressions" to identify and project key price levels where the market is likely to find support or resistance. For more information about the proc

Mandelbrot-Fibonacci Cascade Vortex (MFCV)Mandelbrot-Fibonacci Cascade Vortex (MFCV) - Where Chaos Theory Meets Sacred Geometry
A Revolutionary Synthesis of Fractal Mathematics and Golden Ratio Dynamics
What began as an exploration into Benoit Mandelbrot's fractal market hypothesis and the mysterious appearance of Fibonacci sequences i

EMD Trend [InvestorUnknown]EMD Trend is a dynamic trend-following indicator that utilizes Exponential Moving Deviation (EMD) to build adaptive channels around a selected moving average. Designed for traders who value responsive trend signals with built-in volatility sensitivity, this tool highlights directional bias, market

Bear Market Probability Model# Bear Market Probability Model: A Multi-Factor Risk Assessment Framework
The Bear Market Probability Model represents a comprehensive quantitative framework for assessing systemic market risk through the integration of 13 distinct risk factors across four analytical categories: macroeconomic indic

Range Filter [DW]This is an experimental study designed to filter out minor price action for a clearer view of trends.
Inspired by the QQE's volatility filter, this filter applies the process directly to price rather than to a smoothed RSI.
First, a smooth average price range is calculated for the basis of the fil

Delta Volume Columns Pro [LucF]█ OVERVIEW
This indicator displays volume delta information calculated with intrabar inspection on historical bars, and feed updates when running in realtime. It is designed to run in a pane and can display either stacked buy/sell volume columns or a signal line which can be calculated and dis

BERLIN CandlesA problem with Heikin Ashi is that while it gives you a great overview of overall direction, it is rarely possible to use it as a replacement for normal japanese
candlesticks. The reason for this is that actual price data is lost, since the candles are more akin to a moving average than a different

Support Resistance ChannelsHello All,
For Long time I was planning to make Support/Resistance Channels script, finally I had time and here it is.
How this script works?
- it finds and keeps Pivot Points
- when it found a new Pivot Point it clears older S/R channels then;
- for each pivot point it searches all pivot po

MathSpecialFunctionsConvolve1DLibrary "MathSpecialFunctionsConvolve1D"
Convolution is one of the most important mathematical operations used in signal processing. This simple mathematical operation pops up in many scientific and industrial applications, from its use in a billion-layer large CNN to simple image denoising.
___

See all indicators and strategies
News didn't load
Looks like that didn't go very well. Let's try again.
Community trends
Tesla Crashed 57% — Here’s What History Says Happens AfterThose who knows me you know Im Tesla Bull. I got a longterm vision for Robotics and AI. Which I think Tesla will be big part of it. Whether you like Elon Musk or not Tesla will participate. Can. his behavior and politics acitivities affect Tesla stocks? Absolutely, Im aware that this is risky long

GAME CRACK!GAME is one of the easiest stocks to short.
Just wait for the bearish signal and take the trade. Over and over and over again.
Anyone who wishes to learn what Bull Traps are should study GME chart.

Navitas Semiconductor Corporation No more Up prices , Stock starting it's C wave side in Running flat correction.
Expected 5.5$ end of correction or could be less.
Any rise means Distribution more .
Be very Careful with Stock now ... 🚷🚷🚷🚷

PCG | Potential Reversal Zone at LT Support + Breakdown Retest📍 Ticker: NYSE:PCG (Pacific Gas & Electric Co.)
📆 Timeframe: 1W (Weekly)
💡 Pattern: Head and Shoulders Breakdown → Testing Key Support
📉 Price: $14.79 (as of last candle close)
📊 Volume: 87M
📉 RSI: 32.92 (approaching oversold)
🔍 Technical Setup:
A Head and Shoulders top has completed, with price

PayPal: Rebound or Rerun?PayPal in 2025: A breakout with backbone or just another spineless fintech?
PayPal is still in the rehabilitation ward after its fall from grace in 2021. Management drama, growth slowdown — the full fintech fatigue package. But something has shifted behind the scenes. A new CEO is cutting costs, AI

Time to buy? Too much negative press. Buy in Fear. Apple has faced a significant amount of negative press recently, which has created a lot of fear and critical perceptions. This situation indicates that in times of fear, you should buy, and in times of greed, you should sell. As a result, I have taken a substantial long position on Apple.
The flag

covered call on COINCryptos are pumping.. Trend is bullish. Moving averages, gaps, volume, everything looks like this should eventually resolve higher.

Amd - This is just the beginning!Amd - NASDAQ:AMD - perfectly plays out:
(click chart above to see the in depth analysis👆🏻)
Despite the harsh drop of about -65% which we have been witnessing starting back in 2024, Amd remains bullish. Just three months ago, Amd retested a textbook confluence of support. We saw bullish confirm

Dollar general high tight flagHigh tight flag formation on daily consolidation on low volumes
entry 115.20
sl - 4%
tp- 122

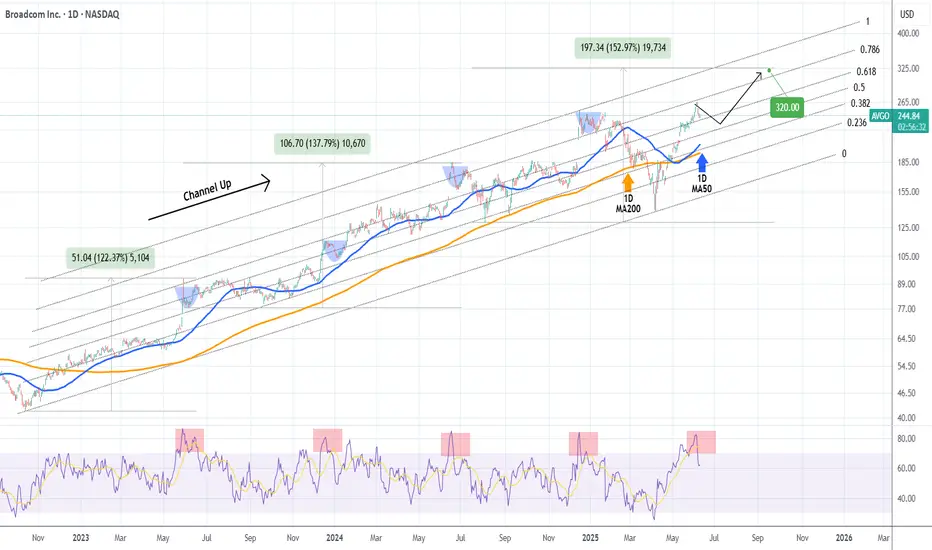
BROADCOM Pull-back to demand zone possible before new High.Broadcom Inc. (AVGO) is currently on a 3-day pull-back that started right on the 0.786 Fibonacci level of the 2.5 year Channel Up. The 1D RSI got heavily rejected from deep inside the overbought zone (>70.00) to back down below it and the only times that happened within this pattern, was during shor
See all stocks ideas
Today
JILLJ. Jill, Inc.
Actual
0.88
USD
Estimate
0.86
USD
Today
SAILSailPoint, Inc.
Actual
0.01
USD
Estimate
−0.01
USD
Today
CGNTCognyte Software Ltd.
Actual
—
Estimate
0.01
USD
Today
CHWYChewy, Inc.
Actual
0.15
USD
Estimate
0.17
USD
Today
VSCOVictorias Secret & Co.
Actual
0.09
USD
Estimate
0.07
USD
Today
PODCPodcastOne, Inc.
Actual
—
Estimate
−0.04
USD
Today
VRAVera Bradley, Inc.
Actual
−0.36
USD
Estimate
−0.12
USD
Today
ORCLOracle Corporation
Actual
—
Estimate
1.64
USD
See more events
News didn't load
Looks like that didn't go very well. Let's try again.
Community trends
Bitcoin - Pump will continue! Sell here, thank me later.Bitcoin has been pumping in the past few days pretty massively. Why? There are 2 main reasons - the first reason is that Bitcoin has finished a major WXY corrective wave, and the second is that Bitcoin swept liquidity below a triangle (see my previous post for details). That was a very good opportun

ETH/USD.1D CHART PATTERN.I'm looking at a long trade idea on ETH/USD with the following structure:
Buy Entry: $2,740
Target 1: $3,320
Target 2: $4,000
Here's a breakdown of the trade setup and key considerations:
---
📈 Trade Summary
Parameter Value
Entry $2,740
Target 1 $3,320
Target 2 $4,000
Potential Upside (to

Bitcoin At Resistance: OMG! Not Another 20X SHORT!Sell at resistance; buy at support.
Good morning my fellow Cryptocurrency trader, I hope you are having a wonderful day.
Being able to adapt to changing market conditions is one of the signs of being a great trader. Being able to spot changes on a chart is also indicative of someone that can produ

Bitcoin - Bulls in Control: Aiming For $110kBitcoin has just confirmed a strong bullish breakout after consolidating beneath a prior fair value gap. The market not only broke out of that zone cleanly but did so with conviction, creating a new inversion fair value gap (IFVG) along the way. This type of structure often indicates a shift in sent

ETH Bullish Setup: Pullback to 200_SMA(D) May Launch Next Rally Ethereum ( BINANCE:ETHUSDT ) seems to have finally managed to break the Resistance lines and the 200_SMA(Daily) in the fifth attack . However, the number of Resistance lines inside the Heavy Resistance zone($2,929_$2,652) is high, and Ethereum will find it difficult to break through them.

BTCUSD Analysis Today: Technical and On-Chain !In this video, I will share my BTCUSD analysis by providing my complete technical and on-chain insights, so you can watch it to improve your crypto trading skillset. The video is structured in 4 parts, first I will be performing my complete technical analysis, then I will be moving to the on-chain d

ETHEREUM (ETHUSD): Bullish Continuation is Coming?!📈ETHEREUM is in a long-term bullish trend, but since late May, it has been consolidating within a horizontal range.
However, the price bounced yesterday and closed above the range's resistance, which is likely to initiate a trend-following movement.
The next resistance level is at 3000.

INJUSDT I Weekly CLS I Short in the Model 2 zoneHey, Market Warriors, here is another outlook on this instrument
If you’ve been following me, you already know every setup you see is built around a CLS Footprint, a Key Level, Liquidity and a specific execution model.
If you haven't followed me yet, start now.
My trading system is completely

TradeCityPro | Bitcoin Daily Analysis #113👋 Welcome to TradeCity Pro
Let’s dive into the Bitcoin analysis and key crypto indexes. As usual in this analysis, I’ll walk you through the futures triggers for the New York session.
⏳ 1-Hour Timeframe
As you can see in the one hour timeframe, Bitcoin has continued its upward movement and reached

$XRP - Falling Wedge Breakout is CookingRipple is forming a simple yet perfect setup
There is a strong horizontal support level of $2.11 that was established back in December of 2024 and has held the price perfectly (with only one breakdown) since then. Moreover, at that time a massive Falling Wedge started forming and is still doin

See all crypto ideas
News didn't load
Looks like that didn't go very well. Let's try again.
Lingrid | GOLD resistance Swap Zone Shorting OpportunityOANDA:XAUUSD is approaching a critical retest of the broken upward trendline and swap zone near 3342 after failing to maintain resistance above the 3400 area. The prior double top pattern and bearish divergence signal weakening momentum. If the price is rejected at the retest level, a move toward 3

GOLD ROUTE MAP UPDATEHey Everyone,
Quick update following on from yesterday’s post.
As expected, we got the push up after the EMA5 cross and lock above 3318, but price just fell short of our bullish target at 3352, leaving it open. This level now acts as a magnet, with price currently playing between 3318 and 3352, cr

THE KOG REPORT - UpdateEnd of day update from us here at KOG:
Not a bad day on the markets but the ranging only allowed us to scalp and take short trades from the bias level published and the extension level which did give an extremely decent move downside.
We now have support at the 3320 level with resistance 3330 wh

Gold’s back on track, paying attention to momentum and hintsXAUUSD is still climbing steadily within its upward parallel channel, respecting structure beautifully as we’re now seeing early signs of bullish interest returning, right after we got a nice rejection from the support zone.
Currently I’m watching this bounce to have a target near 3,380 , somewher

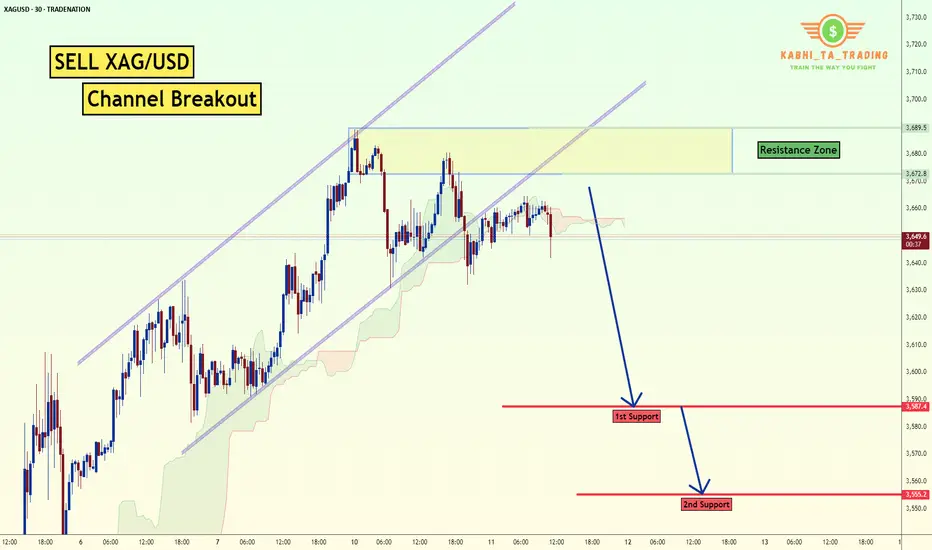
XAG/USD - Channel Breakout (11.06.2025) The XAG/USD Pair on the M30 timeframe presents a Potential Selling Opportunity due to a recent Formation of a CHannel Breakout Pattern. This suggests a shift in momentum towards the downside in the coming hours.
Possible Short Trade:
Entry: Consider Entering A Short Position around Trendline O
#XAUUSD[GOLD]:+2200 Pips Big Move! | Setupsfx_|Gold is currently accumulating in smaller timeframes, which suggests it’s in the early stages of a significant move. It’s possible that the price will reverse from either of the entry zones. There are three take-profit areas you can target, but only if they align with your view. This is an education

GOLD NEXT MOVE (expecting a bearish move)(09-06-2025)Go through the analysis carefully and do trade accordingly.
Anup 'BIAS for the day (09-06-2025)
Current price- 3328
"if Price stays below 3336-38, then next target is 3318, 3308, 3290 and 3270 and above that 3348 and 3360 ".
-POSSIBILITY-1
Wait (as geopolitical situation are worsening )
-POSSIB

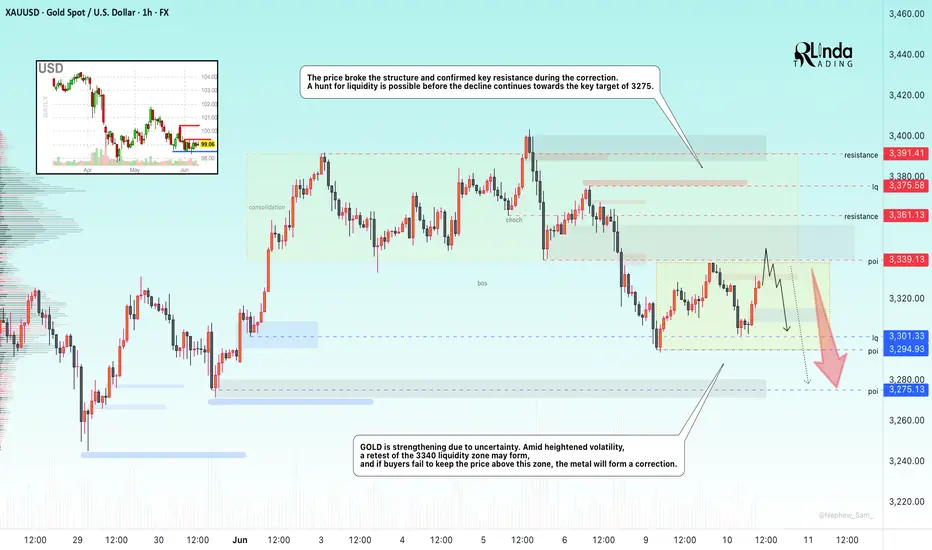
GOLD → Hunt for liquidity ahead of continued correctionFX:XAUUSD is strengthening due to uncertainty while the dollar consolidates. Amid heightened volatility, a retest of the 3340 liquidity zone may form, and if buyers fail to keep the price above this zone, gold may form a correction
Demand for the dollar is supported by the rise in USD/JPY afte
Platinum 10 years accumulation 2 000 USD Overview of Catalysts
Here’s a detailed look at the top 10 key catalysts influencing platinum prices—and how they stack up on a 0–10 impact scale 🎯.
1. Supply Deficits (Mining Shortfalls) ⛏️
Trend: Persistent structural deficits—the largest since 2013—with a projected deficit of \~598 koz in 2024.
Drivers: Declining ou

CPI, US inflation, gold price waiting to decrease⭐️GOLDEN INFORMATION:
Gold (XAU/USD) drew fresh bids in Wednesday’s Asian trading, reclaiming the $3,340 level and edging back toward this week’s high. A U.S. federal appeals court decision allowing President Donald Trump’s broad tariffs to remain in force—for now—added a fresh layer of trade uncer

See all futures ideas
News didn't load
Looks like that didn't go very well. Let's try again.
EURUSD - Waiting for the Breakdown After 4H SweepEURUSD has just completed a sweep of the 4H highs, tagging liquidity resting above the consolidation range. That move looks like a classic inducement, with price now reacting lower and showing signs of weakness. This type of sweep, especially when it happens inside a range, often leads to a reversal

NZD/USD..1h chart pattern..NZD/USD 1H chart appears to show a bullish breakout pattern, supported by:
An ascending trendline.
Price holding above the Ichimoku cloud.
A clear breakout projection drawn with an arrow to a higher level.
---
🔍 Estimated Target Based on Chart Structure
Based on visual estimation and the pat

Euro may reach seller zone and then continue to declineHello traders, I want share with you my opinion about Euro. In this chart, the price started to grow, bouncing from the support line, and soon reached the support level, which coincided with the buyer zone. Then it declined to support line, making the correction and then made an impulse up from this

USD/CAD - Channel Breakout (10.06.2025)The USD/CAD pair on the M30 timeframe presents a Potential Buying Opportunity due to a recent Formation of a Channel Breakout Pattern. This suggests a shift in momentum towards the upside and a higher likelihood of further advances in the coming hours.
Possible Long Trade:
Entry: Consider Enterin

USD/JPY – Short-term bullish structure within a larger downtrendThe USD/JPY pair has been in a well-established downtrend on the daily timeframe, showing consistent weakness over recent weeks.
Daily timeframe
The pair recently bounced from a significant and well-respected support zone around the $140.00 level. This area has historically provided a strong bas

EURJPY - Already Over-Bought!Hello TradingView Family / Fellow Traders. This is Richard, also known as theSignalyst.
📈EURJPY has been overall bullish trading within the rising wedge pattern marked in blue. However, it is currently retesting the upper bound of the wedge.
Moreover, the green zone is a major weekly high.
🏹 Th

Analysis and Forecast for EUE/USDToday, the EUR/USD pair is under pressure, having failed to consolidate above the 1.1447 level and showing intraday declines toward the psychological level of 1.1415 and below, amid U.S. dollar strength.
The main drive of the dollar's rise was Friday's strong U.S. Non-Farm Payrolls (NFP) report,

GBPJPY at a Turning Point: Triple Top Signals Potential DeclineGBPJPY at a Turning Point: Triple Top Signals Potential Decline
Fundamental Analysis:
GBP is showing signs of weakness against the Japanese Yen following the latest UK employment data. The UK unemployment rate rose to 4.6% for the three months ending in April, while the Claimant Count Change inc

NZDUSD Potential UpsidesHey Traders, in today's trading session we are monitoring NZDUSD for a buying opportunity around 0.60350 zone, NZDUSD is trading in an uptrend and currently is in a correction phase in which it is approaching the trend at 0.60350 support and resistance area.
Trade safe, Joe.

Lingrid | GBPJPY potential Extension after Bullish BreakoutOANDA:GBPJPY is consolidating just above the key support around 195.05 after bouncing from a higher low and failing to hold the recent breakout above PMH. The bullish structure remains intact within the upward channel, but the pair is currently lacking momentum. If price holds above 195.00 and form

See all forex ideas
| - | - | - | - | - | - | - | ||
| - | - | - | - | - | - | - | ||
| - | - | - | - | - | - | - | ||
| - | - | - | - | - | - | - | ||
| - | - | - | - | - | - | - | ||
| - | - | - | - | - | - | - | ||
| - | - | - | - | - | - | - | ||
| - | - | - | - | - | - | - |
News didn't load
Looks like that didn't go very well. Let's try again.
Trade directly on the supercharts through our supported, fully-verified and user-reviewed brokers.


