Why Recursion Pharmaceuticals RXRX Could Be the NVDA of BiotechRecursion Pharmaceuticals RXRX is rapidly emerging as a transformative force in drug discovery, leveraging cutting-edge artificial intelligence and automation to industrialize and accelerate the development of new medicines. Here’s why RXRX could be the next NVIDIA (NVDA) of biotechnology and why it

The best trades require research, then commitment.
Get started for free$0 forever, no credit card needed

Scott "Kidd" PoteetThe unlikely astronaut

Where the world does markets
Join 100 million traders and investors taking the future into their own hands.

MGY: Technical Breakout + Fundamental Momentum = Quiet Winner?Magnolia Oil & Gas (MGY) is showing one of the cleanest technical breakouts in the energy sector — and the market hasn’t priced it in yet. After months of pressure, price has broken above both the 50-day and 200-day moving averages with rising volume, signaling a clear phase shift from distribution

Gold Takes the Throne as Safe Haven AgainThe recent escalation in the Middle East — particularly Israel’s surprise strike on Iran — has stirred up significant volatility in global financial markets. Oil prices surged, stock markets around the world turned red, just as many had predicted. However, in a surprising twist, capital did not rush

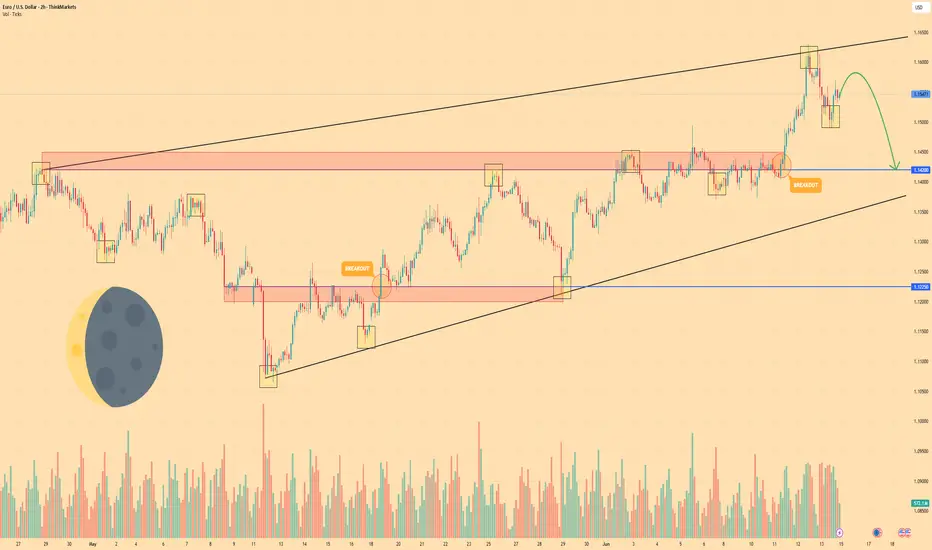
EUR/USD: Euro Pops Above $1.16 in Four-Year High. What’s Next?The dollar wobbles, Trump talks tariffs, and the euro’s got its dancing shoes on.
The Euro Wakes Up, Stretching Its Legs at $1.16
Look who just rolled out of bed and decided to make a scene.
For the first time in four years, the euro has finally leapt out of its slumber and sprinted to $1.16 —

ETHEREUM: THE NEW BOND OF THE DIGITAL WORLDPrice isn’t the goal. Price is the side effect.
Meanwhile, BlackRock - a black hole with a trust-backed logo - just absorbed 42,000 ETH more.
Yesterday, you may have read this "regular" headline:
BlackRock increases its Ethereum exposure to $4 billion, adding $109.5 million via ETFs.
But here’s w

Silver surge has more bullish upsideSilver is breaking out. Its strength is no accident. The US is running a structural deficit north of 6% of GDP in a full-employment economy. The bond market has absorbed the pain so far, but pressure is building. Investors are starting to look for insurance. Silver is one of the cleanest ways to pl

Soaring platinum breaks a 3 year high at $1,152.50/ozChina, the world’s largest consumer of platinum, imported its highest amount in a year last month. Retail investment demand (bars and coins) in China more than doubled, overtaking North America as the top market for platinum investment.
Analysts at Bloomberg Intelligence predict that global platinum

Elon Musk vs Trump: Who you betting on?Elon Musk and Donald Trump have recently had a public falling-out, with their feud playing out on social media and in political circles.
The dispute seems to have started over Trump's new budget bill, which Musk has criticized for increasing the national debt. Trump, in turn, accused Musk of being

OptionsMastery: Inverse head and shoulders on UAL! 🔉Sound on!🔉
📣Make sure to watch fullscreen!📣
Thank you as always for watching my videos. I hope that you learned something very educational! Please feel free to like, share, and comment on this post. Remember only risk what you are willing to lose. Trading is very risky but it can change your life!

The MSCI World index sets a new all-time record!The MSCI World stock market index set a new all-time record during the trading session of Monday June 2, wiping out the entire stock market shock of February/March, which saw the global equity market lose 20%. This technical signal still needs to be confirmed at the end of the week at the next weekl

See all editors' picks ideas
Trend Impulse Channels (Zeiierman)█ Overview
Trend Impulse Channels (Zeiierman) is a precision-engineered trend-following system that visualizes discrete trend progression using volatility-scaled step logic. It replaces traditional slope-based tracking with clearly defined “trend steps,” capturing directional momentum only when

Magnificent 7 OscillatorThe Magnificent 7 Oscillator is a sophisticated momentum-based technical indicator designed to analyze the collective performance of the seven largest technology companies in the U.S. stock market (Apple, Microsoft, Alphabet, Amazon, NVIDIA, Tesla, and Meta). This indicator incorporates established

SmartPhase Analyzer📝 SmartPhase Analyzer – Composite Market Regime Classifier
SmartPhase Analyzer is an adaptive regime classification tool that scores market conditions using a customizable set of statistical indicators. It blends multiple normalized metrics into a composite score, which is dynamically evaluated

ATR RopeATR Rope is inspired by DonovanWall's "Range Filter". It implements a similar concept of filtering out smaller market movements and adjusting only for larger moves. In addition, this indicator goes one step deeper by producing actionable zones to determine market state. (Trend vs. Consolidation)
>

Langlands-Operadic Möbius Vortex (LOMV)Langlands-Operadic Möbius Vortex (LOMV)
Where Pure Mathematics Meets Market Reality
A Revolutionary Synthesis of Number Theory, Category Theory, and Market Dynamics
🎓 THEORETICAL FOUNDATION
The Langlands-Operadic Möbius Vortex represents a groundbreaking fusion of three profound mathematic

Risk-Adjusted Momentum Oscillator# Risk-Adjusted Momentum Oscillator (RAMO): Momentum Analysis with Integrated Risk Assessment
## 1. Introduction
Momentum indicators have been fundamental tools in technical analysis since the pioneering work of Wilder (1978) and continue to play crucial roles in systematic trading strategies (Jeg

TrendMaster Pro 2.3 with Alerts
Hello friends,
A member of the community approached me and asked me how to write an indicator that would achieve a particular set of goals involving comprehensive trend analysis, risk management, and session-based trading controls. Here is one example method of how to create such a system:
Core

Support and Resistance Logistic Regression | Flux Charts💎 GENERAL OVERVIEW
Introducing our new Logistic Regression Support / Resistance indicator! This tool leverages advanced statistical modeling "Logistic Regressions" to identify and project key price levels where the market is likely to find support or resistance. For more information about the proc

Mandelbrot-Fibonacci Cascade Vortex (MFCV)Mandelbrot-Fibonacci Cascade Vortex (MFCV) - Where Chaos Theory Meets Sacred Geometry
A Revolutionary Synthesis of Fractal Mathematics and Golden Ratio Dynamics
What began as an exploration into Benoit Mandelbrot's fractal market hypothesis and the mysterious appearance of Fibonacci sequences i

EMD Trend [InvestorUnknown]EMD Trend is a dynamic trend-following indicator that utilizes Exponential Moving Deviation (EMD) to build adaptive channels around a selected moving average. Designed for traders who value responsive trend signals with built-in volatility sensitivity, this tool highlights directional bias, market

See all indicators and strategies
News didn't load
Looks like that didn't go very well. Let's try again.
Community trends
MGY: Technical Breakout + Fundamental Momentum = Quiet Winner?Magnolia Oil & Gas (MGY) is showing one of the cleanest technical breakouts in the energy sector — and the market hasn’t priced it in yet. After months of pressure, price has broken above both the 50-day and 200-day moving averages with rising volume, signaling a clear phase shift from distribution
Why Recursion Pharmaceuticals RXRX Could Be the NVDA of BiotechRecursion Pharmaceuticals RXRX is rapidly emerging as a transformative force in drug discovery, leveraging cutting-edge artificial intelligence and automation to industrialize and accelerate the development of new medicines. Here’s why RXRX could be the next NVIDIA (NVDA) of biotechnology and why it
UPWORK Long Idea. $UPWKRounding bottom with multi-year resistance between $16-$18. Accumulate shares at current levels. Expecting a breakout by September 2025.

LOADINGQBTS hasn't tested the 200 EMA since early May, now it is consolidating on it; also, on top of an unfilled price gap. The Bears would want for price break below the 14.70 200 EMA and fill the gap and test the 13.35 price area, bulls want price to break the trendline with volume and momentum and reac

NVDA: Options GEX & Technical Setup for Jun 161️⃣ Options Gamma Insights
* Strongest gamma resistance sits in the 140–145 zone, with a hefty 3rd CALL wall (~79%) and consistent NETGEX/Call shelf near 145.
* IV is ultra low (~6.4 vs avg 46.5), meaning traders benefit from moves more than decay—especially as price nears gamma protection levels.
*

$AAPL In ConsolidationNASDAQ:AAPL is consolidating here in a wedging pattern. I do not know which way this will resolve. But, since I rarely if ever short, I am looking on the long side of a trade. The thing I like about a consolidation pattern like this is, you know when you are wrong very quickly. My plan is to take a

QBTS - Is it worth Investing?Hello All,
As i mentioned my previous IONQ publishment , second Quantum Computer company is QBTS.
First of all some figures for QBTS:
Revenue: $15.0 million — up +509% year‑over‑year
Net Loss: $5.4 million (−$0.02 per share), improved from a $17.3 million loss in Q1 2024
Cash Resources: $304 mill

$NCNA – Classic Bull Flag Forming! Breakout & Clinical CatalystPotential upside of 600%
Chart Setup (1‑Hr):
📈 Massive gap‑up on strong volume—ideal bull flag “pole.”
⚠️ Downward‑sloping consolidation channel = textbook bull flag.
🔥 Volume tapering during consolidation—often precedes sharp breakouts.
🚀 Approaching breakout near channel resistance (~$0.14),

WC: 22.14 Target: 1800-2400 MOASS: 47k-100K: What Now?As I said in the end of day update yesterday the WEEK OF 06/09 was a doozy.
As part of my #GME20WeekCycle theory that week is significant as it is one of the few dates The Cat specifically "gave us" in his tweets...and serves as significant "line in the sand" from which we should look for significa

TESLA WILL GO DOWN|SHORT|
✅TESLA is going up now
But a strong resistance level is ahead at 336$
Thus I am expecting a pullback
And a move down towards the target of 320$
SHORT🔥
✅Like and subscribe to never miss a new idea!✅
Disclosure: I am part of Trade Nation's Influencer program and receive a monthly fee for

See all stocks ideas
Today
AIOTPowerFleet, Inc.
Actual
−0.09
USD
Estimate
−0.02
USD
Today
CODACoda Octopus Group, Inc.
Actual
0.08
USD
Estimate
0.03
USD
Today
PODCPodcastOne, Inc.
Actual
—
Estimate
−0.04
USD
Today
CRWSCrown Crafts, Inc.
Actual
—
Estimate
—
Today
RNWReNew Energy Global plc
Actual
0.13
USD
Estimate
0.04
USD
Today
APPSDigital Turbine, Inc.
Actual
—
Estimate
0.04
USD
Today
GLBSGlobus Maritime Limited
Actual
—
Estimate
−0.09
USD
Today
LENLennar Corporation
Actual
—
Estimate
1.94
USD
See more events
News didn't load
Looks like that didn't go very well. Let's try again.
Community trends
Bitcoin Consolidation: Easy, Walk Away.Bitcoin consolidation in progress. The easiest thing to do in these situations is avoid taking any trades until a new trend is established. Even smaller time frames will be harder to trade unless you are employing mean reversion strategies. At some point the market will choose which way it wants to

Geopolitical Tensions & Technical Pattern Point to BTC Decline!Bitcoin ( BINANCE:BTCUSDT ) fell about -5% after tensions between Israel and Iran escalated. Unfortunately , these tensions are still escalating, but Bitcoin has managed to recover about +3% so far.
Bitcoin is moving near the Resistance zone($107,120-$105,330) and Cumulative Short Liqui

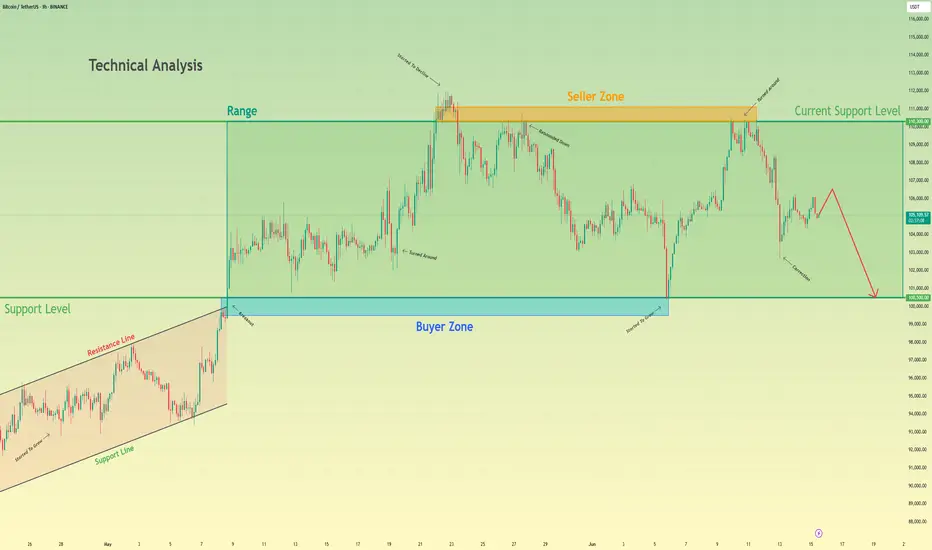
Bitcoin will make a small upward move and then continue to fallHello traders, I want share with you my opinion about Bitcoin. Earlier, the price was confidently growing inside an Upward Wedge, showing a series of higher highs and higher lows. This rising structure was supported by consistent momentum until BTC reached the seller zone between 110300 and 111100,
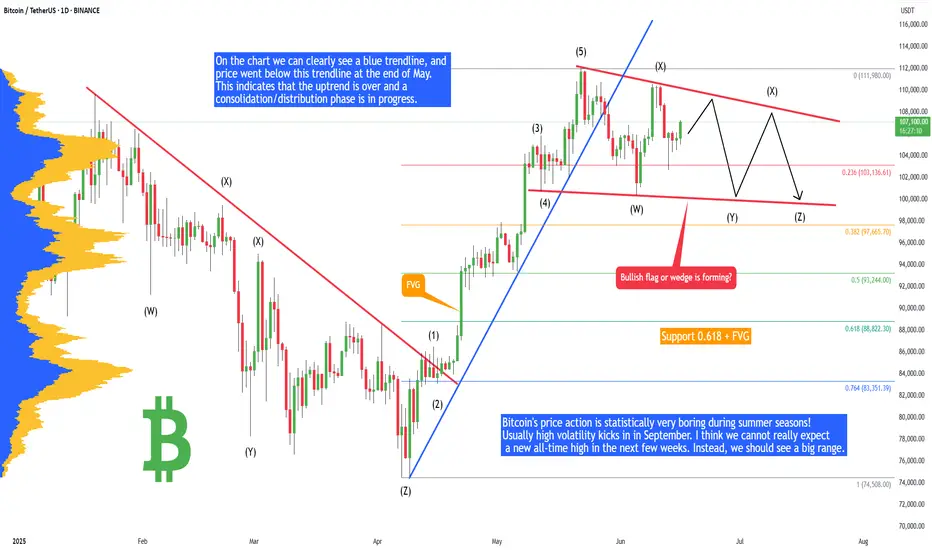
Bitcoin - Plan for summer 2025 (no new ATH, big range!)Bitcoin's price action is statistically very boring during summer seasons! Usually high volatility kicks in in September. I think we cannot really expect a new all-time high in the next few weeks. Instead, we should see a big range. Why? Let's take a look at technical analysis.
On the chart we can
Bitcoin - Bears vs Bulls: $100k next?Price recently tapped into a well-defined 4H and daily resistance zone and was met with an immediate rejection. That rejection wasn’t just a reaction, it led to a confirmed market structure shift as price broke the previous low. This transition from higher highs to a lower low signals the first sign

BTCBTC is in a consolidation, we need this to protect 100K level, if it drops 100K then further downside will follow otherwise its good to go up.
Disclosure: We are part of Trade Nation's Influencer program and receive a monthly fee for using their TradingView charts in our analysis.

ETH is doing it AGAIN!Hello TradingView Family / Fellow Traders. This is Richard, also known as theSignalyst.
📈ETH has been overall bullish trading within the flat rising channels marked in blue.
Moreover, the green zone is a strong support zone!
🏹 Thus, the highlighted blue circle is a strong area to look for buy

BITCOIN - Price can fall a little and start to move upHi guys, this is my overview for BTCUSDT, feel free to check it and write your feedback in comments👊
Price entered to rising channel, where at once bounced from support line and rose a little, and then corrected.
Next, price continued to move up and soon reached $100500 level, after which broke it

Bitcoin, Good News & Good News —Bullish Confirmed (Retrace Over)First, the good news is that we have a higher low and a strong recovery in place. The current candle has a long lower wick and is already trading green, at the top of the session.
The second good news is how far down the retrace went. Last time Bitcoin bottomed around $100,300, this time the bottom
Inverse cup and handle + Symetrical triangle (continuation) ETHInverse cup and handle + Symetrical triangle (down)
Bearish
Target 2100 ish
Thank me later,
The Short Master

See all crypto ideas
News didn't load
Looks like that didn't go very well. Let's try again.
Lingrid | GOLD Weekly Analysis: Geopolitical Safe-Haven RallyOANDA:XAUUSD demonstrated exceptional strength this week as geopolitical tensions from Israeli-Iranian conflicts drove massive safe-haven demand. The metal successfully broke above the critical 3,360 resistance level, confirming the completion of an inverse head and shoulders pattern that has been

XAUUSD Hello Traders! 👋
What are your thoughts on GOLD?
Gold has broken above a major resistance level, and price has closed firmly above this zone, signaling strong bullish momentum and a shift in market sentiment.
We expect a brief pullback in the short term, followed by a resumption of the upward mov
Positive market: OIL rises sharply - Important area to watch forThe recent escalation of tensions in the Middle East has had a strong ripple effect across all commodities market. Just as we observed with Gold, it’s no surprise we’ve seen oil prices climb as well, given this uncertainty.
If you’ve seen my latest Gold analysis, you’ll understand how market senti

GOLD 1H CHART ROUTE MAP UPDATE & TRADING PLAN FOR THE WEEKHey Everyone,
Please see our updated 1h chart levels and targets for the coming week.
We are seeing price play between two weighted levels with a gap above at 3340 and a gap below at 3418. We will need to see ema5 cross and lock on either weighted level to determine the next range.
We will see le

HelenP. I Gold may correct to support zone and then rebound upHi folks today I'm prepared for you Gold analytics. After rebounding from the trend line, XAUUSD began to grow steadily within the rising structure, confidently pushing through local resistance and breaking above the previous support 2 area. This breakout was backed by strong bullish momentum, with

THE KOG REPORTTHE KOG REPORT
In last week’s KOG Report we said we would want the lower level red box to be tested and rejected in order to give us the move upside into that 3330-35 region where we wanted to monitor the price for the short. We managed to get a pin point move, however, we had to exit the short t

XAU/USD,4h chart pattern.Im looking to buy Gold at 3432 with a target of 3500. Here's a quick analysis and trade plan for this idea:
---
🟡 Gold Trade Setup
Buy Entry: 3432
Target (Take Profit): 3500
Potential Gain: 68 points
Suggested Stop Loss: Around 3400 (for a 1:2 risk/reward ratio)
---
📊 Things to Consider:

Gold Takes the Throne as Safe Haven AgainThe recent escalation in the Middle East — particularly Israel’s surprise strike on Iran — has stirred up significant volatility in global financial markets. Oil prices surged, stock markets around the world turned red, just as many had predicted. However, in a surprising twist, capital did not rush
GOLD H4 Update: Bulls will target 3600/3750 USD Market Update🏆 Gold Market Mid-Term Update (June 16, 2025)
📊 Price & Technical Outlook
Current Spot Price: around $3,414
Technical Setup
* Gold consolidating above major support at \~\$3,180–3,200
* Testing resistance at \~\$3,380–3,400; breakout could push toward \$3,600
* Recent price action conside

Hanzo / Gold 30 Min ( Accurate Tactical Break Out Zones )🔥 Gold – 30 Min Scalping Analysis (Bearish Setup)
⚡️ Objective: Precision Breakout Execution
Time Frame: 30-Minute Warfare
Entry Mode: Only after verified breakout — no emotion, no gamble.
👌Bullish After Break : 3345
Price must break liquidity with high volume to confirm the move.
👌Bearish

See all futures ideas
News didn't load
Looks like that didn't go very well. Let's try again.
#EURJPY: Major Swing Sell +1100 Pips, One Not To Miss! The Japanese Yen (JPY) is most likely to continue its bullish trend, as the Dollar Index (DXY) is expected to decline due to the ongoing conflict between Israel and Iran. Historically, JPY and CHF, alongside gold and silver, have been favoured by global investors and remain bullish. Strong fundament

EURO - Pirce can make movement up and then drop to $1.1420Hi guys, this is my overview for EURUSD, feel free to check it and write your feedback in comments👊
After entering the wedge, Euro began to slow down, creating a tightening structure between support and resistance.
Price corrected toward the support line of the wedge, where it briefly paused and b
EURUSD Long Setup – Bullish Rejection from Demand ZoneEURUSD remains supported by strong eurozone fundamentals and broad USD softness. The pair has retraced into a key demand zone around 1.1490 and is showing signs of bullish rejection. With the Fed likely to pause further rate hikes and the ECB maintaining a steady tone, the bias favors further upside

GBPJPY Potential DownsidesHey Traders, in tomorrow's trading session we are monitoring GBPJPY for a selling opportunity around 195.600 zone, GBPJPY is trading in a downtrend and currently is in a correction phase in which in which it is approaching the trend at 195.600 support and resistance area.
Trade safe, Joe.

USD/JPY) Bearish trend analysis Read The ChaptianSMC trading point update
Technical analysis iUSD/JPY on the 30-minute timeframe, showing a rejection from resistance zones and a potential move toward lower support levels.
---
Analysis Breakdown
Technical Components:
1. Resistance Zones:
Primary Resistance: Near 145.500 (upper yellow box

EUR/USD Elliott Wave Outlook – Expanded Flat Playing Out?EUR/USD appears to be unfolding a classic expanded flat correction for wave (4):
Wave A formed as a 3-wave zigzag
Wave B retraced beyond the start of A — a key trait of expanded flats
Now looking for a 5-wave C-leg decline toward the 1.1122 – 1.1002 area
Aligned with 1.0–1.618 extensions of A
R

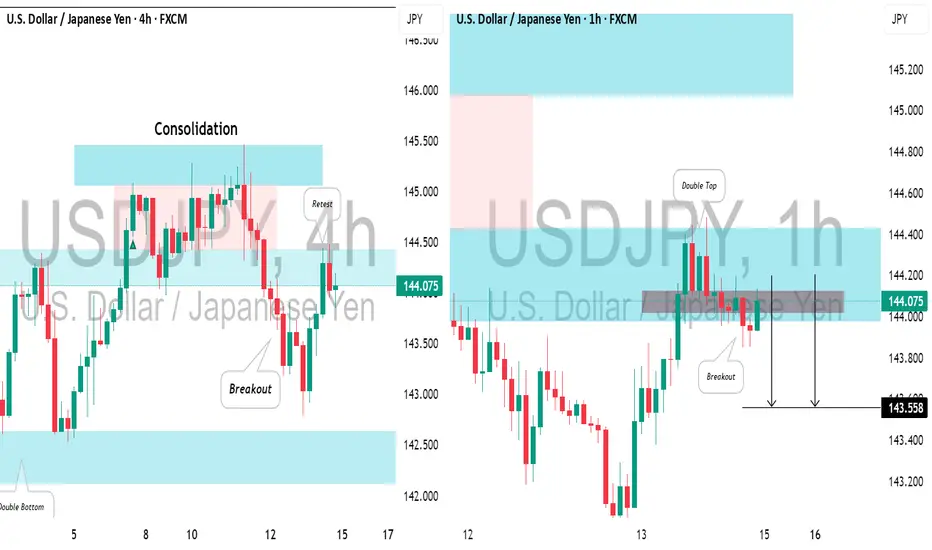
USDJPY: Intraday Bearish ConfirmationIn the middle of last week, I spotted a valid confirmed structure breakout on 📉USDJPY on a 4-hour timeframe.
Currently, the pair is retesting the broken structure, and the price has formed a strong bearish confirmation on the hourly chart.
I see a double top pattern and a violation of its neckli
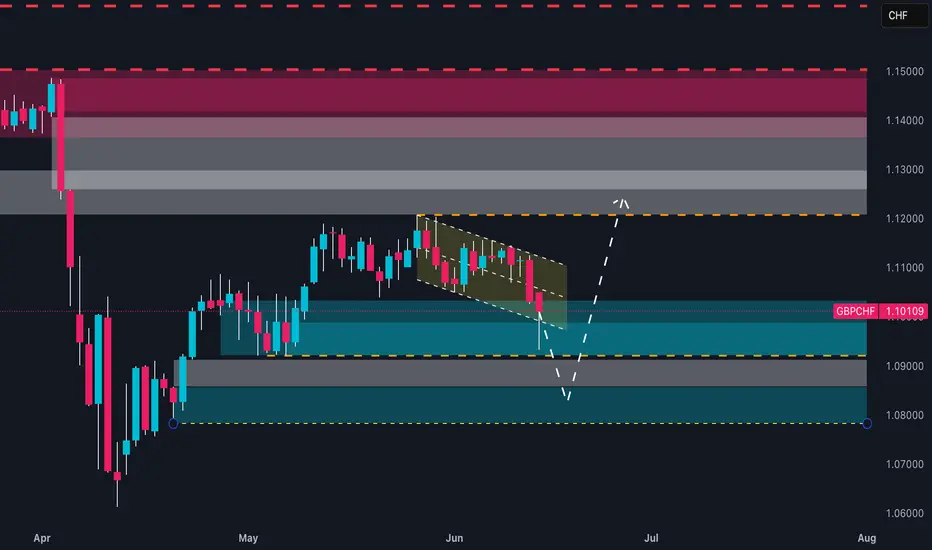
Retail is 86% Long on GBPCHF… But Smart Money Is Setting a Trap📊 1. RETAIL SENTIMENT
Long Positions: 86% – Average Entry: 1.1196
Short Positions: 14% – Average Entry: 1.0999
Current Price: 1.1010
Analysis:
Retail positioning is heavily skewed towards longs, with the average long entry significantly above the current market price. This creates vulnerability t
USDJPY – 4H . [[ TRIANGLE PATTERN ]]Technical Breakdown:
Symmetrical triangle pattern clearly formed with clean ABCDE wave structure.
The price has broken out from the upper resistance (trendline), confirming a bullish breakout scenario.
Next key area to watch is the supply zone near 145.800 – 146.200, where price may either:
Face

EUR/USD 4H CHART PATTERN.EUR/USD 4H chart, the chart analysis shows a bearish outlook after a potential rising channel breakdown. Here are the key bearish targets as shown:
---
📉 Bearish Targets:
1. First Target Zone (FVG Area)
Price Range: Around 1.1400 – 1.1350
This is marked as the Fair Value Gap (FVG) and could ac

See all forex ideas
| - | - | - | - | - | - | - | ||
| - | - | - | - | - | - | - | ||
| - | - | - | - | - | - | - | ||
| - | - | - | - | - | - | - | ||
| - | - | - | - | - | - | - | ||
| - | - | - | - | - | - | - | ||
| - | - | - | - | - | - | - | ||
| - | - | - | - | - | - | - |
News didn't load
Looks like that didn't go very well. Let's try again.
Trade directly on the supercharts through our supported, fully-verified and user-reviewed brokers.


