Let’s talk about technical analysis & stops.Technical analysis is not your decision-making process — it’s a tool to help you structure better trading decisions by studying past price movements to anticipate likely future moves.
👉 Every time you look at a chart, you should decide:
✅ Do I want to trade at all?
✅ What’s my entry?
✅ Where’s my st

The best trades require research, then commitment.
Get started for free$0 forever, no credit card needed

Scott "Kidd" PoteetThe unlikely astronaut

Where the world does markets
Join 100 million traders and investors taking the future into their own hands.

Eth $2,500 Resistance — Will Harmonic Pattern Trigger a Rally?Ethereum Stuck at $2,500 Resistance — Will Harmonic Pattern Trigger a Rally to $3,400?
Ethereum has been trading in a prolonged consolidation phase around the $2,500 level — a region that has acted as resistance for several weeks. This extended period of sideways action could signify either accumul

SOLANA Loves THIS Pattern | BULLISHSolana usually increases alongside ETH. Possible because its a big competitor.
We can see SOL follows ETH very closely, with the exception of dipping earlier than ETH by a week:
In the 4h, we see a push to breakout above the neckline resistance:
In the daily timeframe, SOL is just about to br

Is Bitcoin Working Out a New Leg Up? Onchain Data Says It May BeDiamond hands are waving goodbye and institutions are loading up — it’s why Bitcoin may be struggling to break out of its current consolidation range. How long can this accumulation phase continue?
And yes — we look at the trades of the decade — two transactions where each one moved a cool billie

BTC monthly yelling at us for something interesting ?We read daily news about ETF, accumulation by institutes and scarcity in the exchanges, but I recognize something different in the chart based on multiple indicators. Historically, BTC boomed after touching 50 EMA and whenever it is extended it traces back to 50 EMA on monthly chart. As per current

Gold on the Move – Major Resistance Levels to Watch AheadThe current price action looks strong, and if the bullish momentum continues, we have three main target levels in mind.
The first target is $3,380. This is an important level we expect gold to reach soon if the trend continues upward.
If the price breaks above $3,380, the next target is $3,433. Th

Watch me make $125 liveafter a brutal night in the markets looking to recoup from the losses I took and regain my momentum before we close the trading week tomorrow.

BTC POTENTIAL BULLS TRAP IN DEVELOPMENTI am inspecting the 4 hour candle in comparison to the daily chart on BTC and it seem we have all the characteristics of a bulls trap on the chart. If the next 4 hours candle does not close bullish, it will confirm a bulls trap and price will likely pullback into the triangle. So be cautious trading

Gold setup: ascending triangle and Trump’s debt bombGold just formed an ascending triangle, and a breakout could send it $300 higher. In this video, we analyse the new pattern, the key breakout level, and why Trump’s new tax bill and Powell’s potential replacement could spark a major move. Will fundamentals match the technicals? Watch to find out.

EURUSD Sell analysis/ideaThis analysis is based on the 4-hour timeframe and executed using reversal trading and trend formation. complete explanation in the video!

See all editors' picks ideas
Logarithmic Moving Average (LMA) [QuantAlgo]🟢 Overview
The Logarithmic Moving Average (LMA) uses advanced logarithmic weighting to create a dynamic trend-following indicator that prioritizes recent price action while maintaining statistical significance. Unlike traditional moving averages that use linear or exponential weights, this indic

Volumatic Support/Resistance Levels [BigBeluga]🔵 OVERVIEW
A smart volume-powered tool for identifying key support and resistance zones—enhanced with real-time volume histogram fills and high-volume markers.
Volumatic Support/Resistance Levels detects structural levels from swing highs and lows, and wraps them in dynamic histograms that re

True Close – Institutional Trading Sessions (Zeiierman)█ Overview
True Close – Institutional Trading Sessions (Zeiierman) is a professional-grade session mapping tool designed to help traders align with how institutions perceive the market’s true close. Unlike the textbook “daily close” used by retail traders, institutional desks often anchor their

Open Interest Footprint IQ [TradingIQ]Hello Traders!
Th e Open Interest Footprint IQ indicator is an advanced visualization tool designed for cryptocurrency markets. It provides a granular, real-time breakdown of open interest changes across different price levels, allowing traders to see how aggressive market participation is distribu

Zigzag CandlesCan't deny that I am obsessed with zigzags. Been doing some crazy experiments with it and have many more in pipeline. I believe zigzag can be used to derive better trend following methods. Here is an attempt to visualize zigzag as candlesticks. Next steps probably to derive moving average, atr (alth

MathStatisticsKernelFunctionsLibrary "MathStatisticsKernelFunctions"
TODO: add library description here
uniform(distance, bandwidth) Uniform kernel.
Parameters:
distance : float, distance to kernel origin.
bandwidth : float, default=1.0, bandwidth limiter to weight the kernel.
Returns: float.
triangular(distance

MathConstantsLibrary "MathConstants"
Mathematical Constants
E() The number e
Log2E() The number log (e)
Log10E() The number log (e)
Ln2() The number log (2)
Ln10() The number log (10)
LnPi() The number log (pi)
Ln2PiOver2() The number log (2*pi)/2
InvE() The number 1/e
SqrtE() The n

taLibrary "ta"
█ OVERVIEW
This library holds technical analysis functions calculating values for which no Pine built-in exists.
Look first. Then leap.
█ FUNCTIONS
cagr(entryTime, entryPrice, exitTime, exitPrice)
It calculates the "Compound Annual Growth Rate" between two points i

Tape [LucF]█ OVERVIEW
This script prints an ersatz of a trading console's "tape" section to the right of your chart. It displays the time, price and volume of each update of the chart's feed. It also calculates volume delta for the bar. As it calculates from realtime information, it will not display info

Dominance Pie ChartA different type of charting, the pie chart,
here for showing the available dominance on one chart,
together with the total % dominance per ticker and between brackets
the % rise/fall.
Can be used in every timeframe
(It is normal it takes some time to be loaded)
Cheers!

See all indicators and strategies
News didn't load
Looks like that didn't go very well. Let's try again.
Community trends
7/7/25 - $ses - Still my fav R/R in battery7/7/25 :: VROCKSTAR :: NYSE:SES
Still my fav R/R in battery
- revenue is scaling
- 1Q revenue tripled 4Q last year
- mgmt's speech on last call was "15-25 mm" for 2025
- their software platform is ramping across core (EV/auto) OEMs and basically anyone (tier 1 battery co's)
- if you look at their

WC: 23.59 Target: 1800-2400 MOASS: 47k-100K: PROFITI am a trader...I have one goal at the end of the day: MAKE A PROFIT
This will be my final post on Gamestop as I am now dedicating ALL of my time to Macro Market Coverage...
I FIRMLY believe that there is a high potential for markets to turn SIGNIFICANTLY LOWER over the next year and plan to show

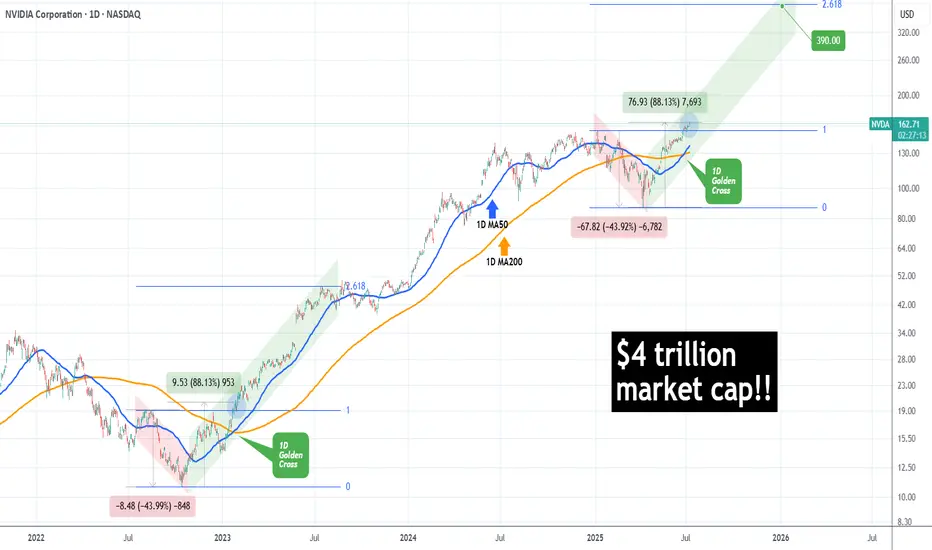
NVIDIA – Best Buy of the Decade (4T Record but now resistance)🚀🔥 NVIDIA – Best Buy of the Decade Post #6
💡📉 Great but why am I taking half profits Today?
Back in July 2021, I named NVIDIA "The Best Buy of the Decade. " Today, it just hit a mind-blowing milestone — becoming the first company to reach a $4 trillion market cap. But here's the thing... that

NVIDIA made history! First company with $4 trillion market cap!NVIDIA Corporation (NVDA) became today the first company in history to surpass a $4 trillion market value, as A.I. bulls extended the recent rally and pushed the price past the approximate $163.93 level needed to reach this market capitalization threshold.
The long-term trend on the 1D time-frame c
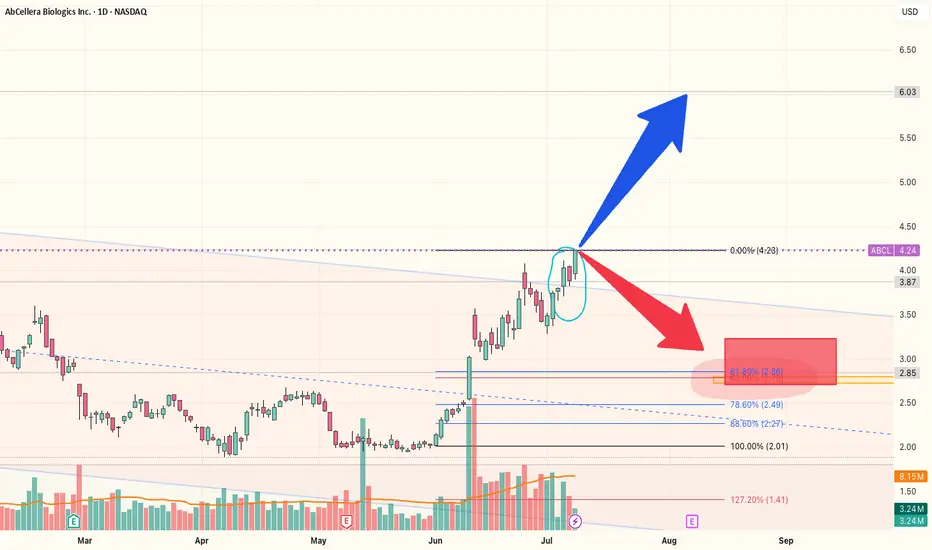
ABCL OTE ESCENARIOSIf the stock brake the weak high US$ 4.00 could be a rally to the next historic resistance US$ 6.03. If not the bullback can go to US$ 2.00. I am confortable at FIBO 61.9 at 2.90 as an OTE. Comments...
WYNN SELL!!$97.49 first target. I believe it can see $117 on this stent so its a good place to start a position and add at $113, $115 and $117 if seen

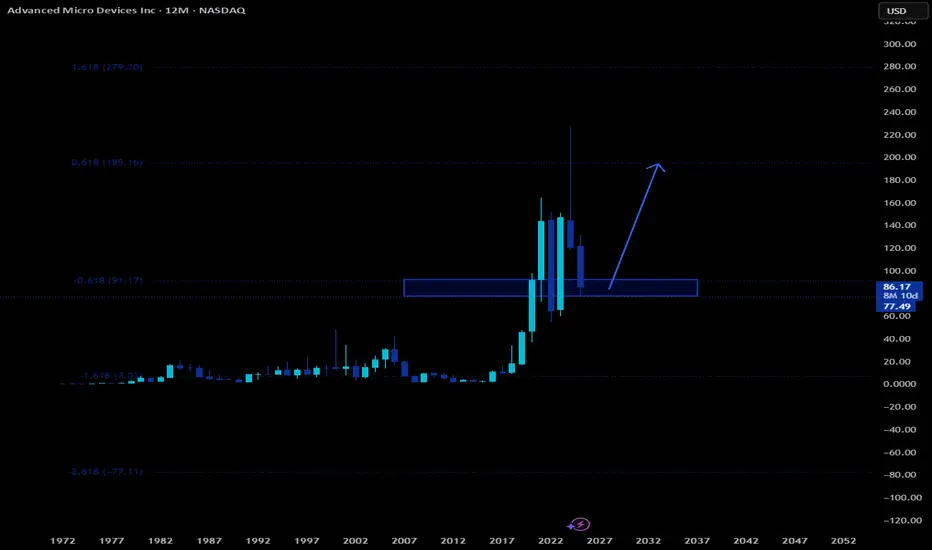
AMD HUGE LONG AMD has a huge level around $180 that is begging to be tested. We are at major support on the yearly. I expect a huge move in AMD in the coming weeks to the upside.
Tesla - Major Breakout BrewingTesla has been going through the wringer, between Robotaxi news, tariffs and the ongoing feud between the most powerful man in the world (Trump) and the richest man in the world (Elon). No doubt the news has had its fair share of impact on the stock. But Technicals will always hold more weight than

July 2025 - Duolingo trading opportunityGood news for Duolingo... The chart is now showing some promising signs that it might be ready to turn things around and head higher. Some simple clues why:
RSI resistance breakout:
The "RSI" indicator (bottom of chart) tells us strength is returning. A break of resistance that has been active ov

SMCI soon above 50 USD! Big bullish move! Youppi!📍 Bullish Trigger Zone: $50 USD
- 🔑 The $50 level acts as a psychological and technical threshold. A breakout above this resistance could signal a bullish reversal.
- 📈 The current price is around $49.11, so it’s very close to the trigger. A daily close above $50 with strong volume would strength

See all stocks ideas
Jul 9
NRIXNurix Therapeutics, Inc.
Actual
−0.52
USD
Estimate
−0.70
USD
Jul 9
MEIMethode Electronics, Inc.
Actual
−0.80
USD
Estimate
0.00
USD
Jul 9
AZZAZZ Inc.
Actual
1.78
USD
Estimate
1.58
USD
Jul 9
BSETBassett Furniture Industries, Incorporated
Actual
0.22
USD
Estimate
0.13
USD
Today
DALDelta Air Lines, Inc.
Actual
—
Estimate
2.06
USD
Today
HELEHelen of Troy Limited
Actual
—
Estimate
0.85
USD
Today
SMPLThe Simply Good Foods Company
Actual
—
Estimate
0.50
USD
Today
CAGConAgra Brands, Inc.
Actual
—
Estimate
0.58
USD
See more events
News didn't load
Looks like that didn't go very well. Let's try again.
Community trends
Bitcoin - Ready for a new all time high! + ALT SEASON startingBitcoin is breaking out of the symmetrical triangle and showing major signs of strength, so we can expect to hit a new all-time high in the short term! Bitcoin was struggling in the past weeks compared to the stock market, but this should end!
Why do I think that the alt season is starting? To answ

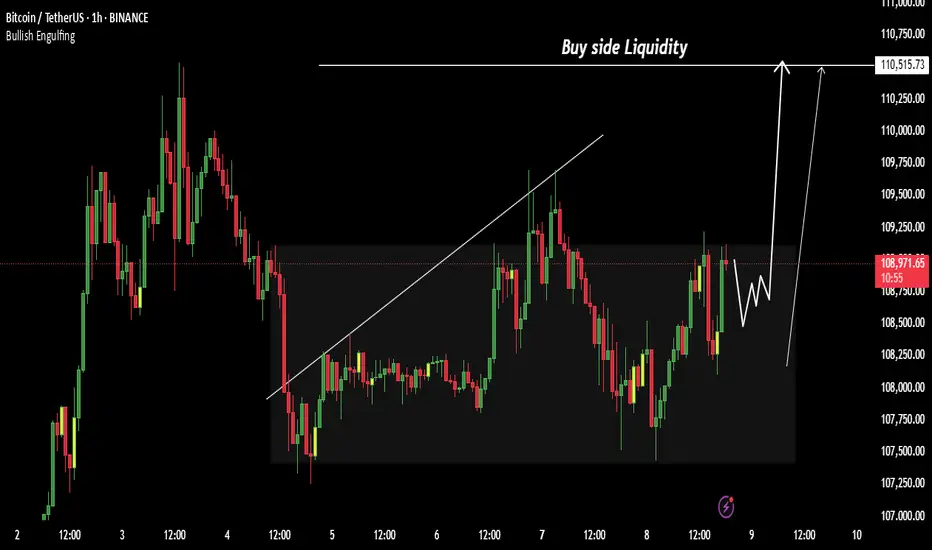
Bitcoin - Liquidity grab at $111.000?This 4-hour BTCUSD chart illustrates a potential short-term bullish continuation scenario followed by a deeper retracement, highlighting key liquidity levels and an important Fair Value Gap (FVG) support zone.
Liquidity sweep
At the top of the current price action, just above the $110,612.16 leve

SOLANA Loves THIS Pattern | BULLISHSolana usually increases alongside ETH. Possible because its a big competitor.
We can see SOL follows ETH very closely, with the exception of dipping earlier than ETH by a week:
In the 4h, we see a push to breakout above the neckline resistance:
In the daily timeframe, SOL is just about to br
Just Two Months Left: Navigating Bitcoin and Global ChangesGreetings to everyone reading these lines! Today, I want to share with you not just an analysis, but my personal reflections and feelings about the current situation in the financial and cryptocurrency markets, especially regarding Bitcoin.
Many of you already know that I have always been a firm be

BITCOIN turning the Bull Flag into Support??Bitcoin (BTCUSD) has been trading sideways, almost flat, since the July 03 High, supported by the 1D MA50 (blue trend-line).
Perhaps the strongest development of the week though is the fact that this consolidation has been taking place at the top (Lower Highs) of what we previously identified as a

Bitcoin – Rejection Confirms Trap, Next Stop: $107kBitcoin attempted to take out the swing high around 110.5k but failed to clear the previous all-time high, resulting in a sharp rejection. This failure marks a significant turning point, suggesting a lack of bullish momentum at premium levels. The rejection came after a sweep of equal highs within a

SOL/USD 2H chart PATTERN.SOL/USD 2H chart, the price is forming a bullish ascending triangle breakout, and it's approaching the upper resistance trendline. If it breaks out with volume, a strong move upward is expected.
📈 Bullish Target Points:
1. First Target:
✅ $157.80 — This is the first horizontal resistance and initi

ETHBTC Opportunity Buy: Major 2025 AltcoinSeason & Bull MarketThis is the big one and the good one. ETHBTC was bearish since December 2021 but this cycle finally came to an end in April this year. After the initial bullish breakout and higher low we can clearly see some bullish action developing; three consecutive weeks green. The bullish bias is now confirmed

BITCOIN → Market manipulation. Chance for growth to 110KBINANCE:BTCUSDT , as part of a correction triggered by negative news from the US regarding tariffs, is testing liquidity in the support zone. There is a chance of recovery to 110K.
Bitcoin is reacting with a decline to fundamentally negative data on tariffs from Trump. Technically, the price i

Bitcoin Expecting Bullish FormationBitcoin could be triggered by negative news from the U.S. regarding tariffs, which may create market uncertainty and push investors toward risk-off or alternative assets like crypto.
Currently, Bitcoin is reacting to the decline caused by fundamental negative data, but bullish sentiment remains ali
See all crypto ideas
News didn't load
Looks like that didn't go very well. Let's try again.
GOLD → Readiness to test the local bottomFX:XAUUSD is under pressure from the rising dollar and uncertainty, breaking through support levels, which opens up a corridor for the market to fall to 3255 - 3246
The price of gold is consolidating around $3300 after falling more than 1% amid expectations of the Fed minutes and news about ta

Lingrid | GOLD Major Support Level ViolatedOANDA:XAUUSD has formed a lower high beneath the key resistance at 3,310, showing fading bullish momentum after a breakout failure. Price is trading below the upward trendline and moving toward the 3,260 support zone with a corrective structure. The rejection from the resistance block and breakdow

Hellena | GOLD (4H): LONG to resistance area of 3397 (Wave 3).Dear colleagues, my previous forecast remains valid, but I have decided to update it.
At the moment, I still think that wave “3” of the medium order continues its upward movement.
At the moment, I think that the small correction in wave “2” is ending and we will see a continuation of the trend. I se

XAU/USD) bearish Trand analysis Read The captionSMC trading point update
Technical analysis of (XAU/USD) on the 3-hour timeframe, projecting further downside after rejection from a resistance zone aligned with a descending trendline.
---
Analysis Summary
Trend Bias: Bearish
Current Price: ~$3,301.96
Structure: Price is respecting a de

GOLD ROUTE MAP UPDATEHey Everyone,
Absolutely beautiful to see our 1h chart idea playing out perfectly. After completing the bearish targets earlier this week, we had the ema5 cross and lock below 3306 opening the swing range.
- This played out perfectly hitting the first swing range level and doing exactly what it

XAG/USD (Silver) - Triangle Breakout (09.07.2025)The XAG/USD (Silver) pair on the M30 timeframe presents a Potential Buying Opportunity due to a recent Formation of a Wedge Breakout Pattern. This suggests a shift in momentum towards the upside and a higher likelihood of further advances in the coming hours.
Possible Long Trade:
Entry: Consider

No Bullish Confirmation – Targeting 3250 on XAU/USDIn yesterday’s analysis, I mentioned that due to Monday’s daily Pin Bar, I closed my short trade on Gold around break-even and decided to wait for more confirmation.
Unfortunately, that wasn't the best decision. The price failed to break above resistance for a bullish continuation and instead dropp

THE KOG REPORT - UpdateEnd of day update from us here at KOG:
Today was another choppy day on gold with price accumulating in a small range before the break out. We had the bullish above and bearish below level so no choice but to wait for the break. Ultimately, 3320 broke on the 15min indi and then we managed to compl

XAU/USD : Gold is falling , When it Stops? (READ THE CAPTION)By analyzing the gold chart on the 4-hour timeframe, we can see that, in line with our latest analysis, the bearish momentum has continued—and even more strongly than expected. Gold has broken below the key $3300 level and is currently trading around $3294.
Given the strong momentum, further downsi

(XAU/USD – Gold vs US Dollar on 4H timeframe)(XAU/USD – Gold vs US Dollar on 4H timeframe), the analysis shows a bearish setup with a breakdown from the ascending trendline and confirmation below the Ichimoku cloud.
1. First Target: 3,220
2. Second Target: 3,180
3. Final Target Zone: 3,130 – 3,100
Note.
Price has rejected from the resis

See all futures ideas
News didn't load
Looks like that didn't go very well. Let's try again.
GBPUSD I Daily CLS I KL - FVG I Model 1Yo Market Warriors ⚔️
Fresh outlook drop — if you’ve been riding with me, you already know:
🎯My system is 100% mechanical. No emotions. No trend lines. No subjective guessing. Just precision, structure, and sniper entries.
🧠 What’s CLS?
It’s the real smart money. The invisible hand behind $7T/d

EURUSD - Compression Before Expansion? Key Reversal ZoneEURUSD is currently trading within a clear descending channel after rejecting a key resistance area. This move signals a shift in short-term sentiment, with bearish momentum guiding price action lower. The channel structure is intact, and as long as price respects this slope, lower levels remain in

EURUSD is Approaching an Important Support!!Hey Traders, in today's trading session we are monitoring EURUSD for a buying opportunity around 1.16400 zone, EURUSD is trading in an uptrend and currently is in a correction phase in which it is approaching the trend at 1.16400 support and resistance area.
Trade safe, Joe.
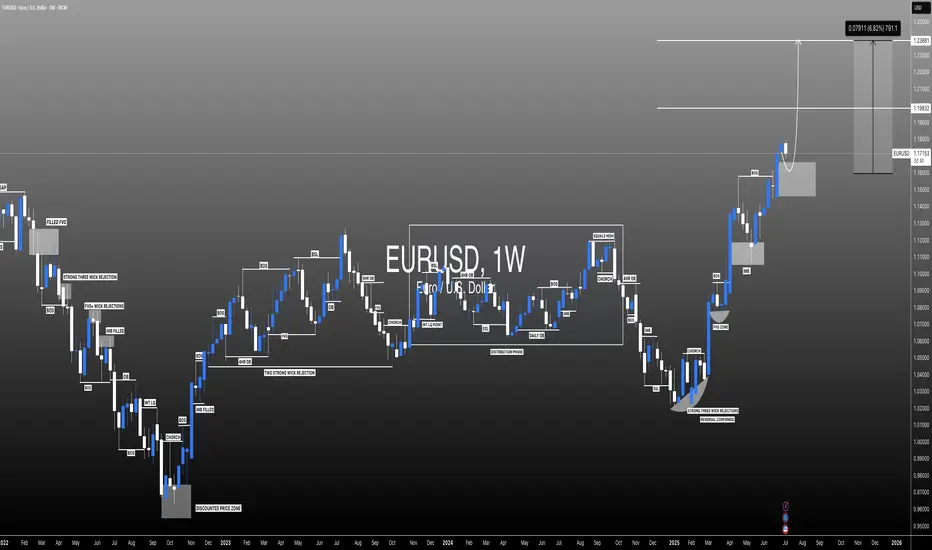
#EURUSD: Last Bullish Price Extension! Get Ready! EURUSD is approaching our buying zone, a key level, which suggests a smooth bullish reversal. As this is a swing trade, we advise keeping stop losses larger. There are two targets to keep an eye on. Remember, this is not a guaranteed move, and this is just our overview. Good luck and trade safely.
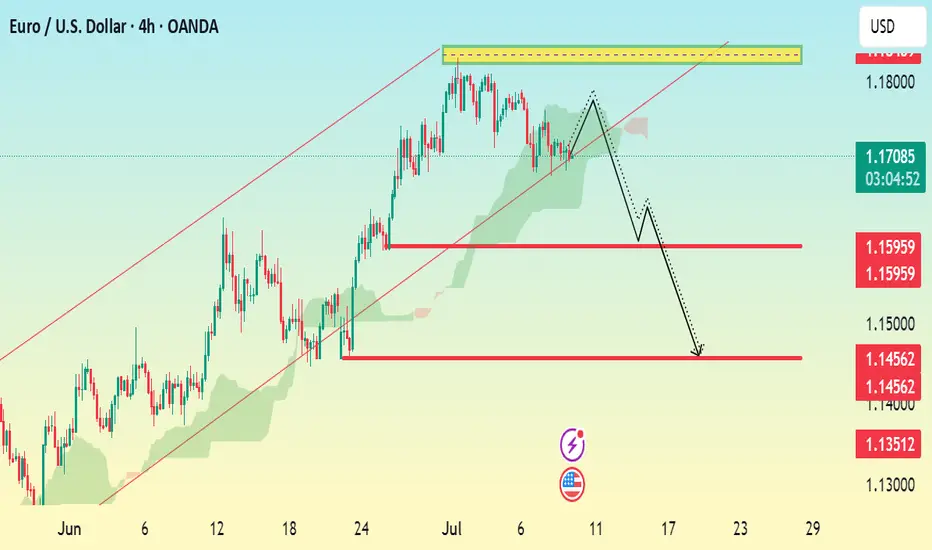
EUR/USD Bearish Setup H4 Chart AnalysisMarket Structure:
Current Price: 1.17057
The market has rejected a key resistance zone around 1.17600–1.17800 (highlighted in yellow).
Price formed a lower high, suggesting bearish momentum is taking control after an uptrend.
The pair is trading around a key trendline and Ichimoku cloud, with a
EURUSDHello Traders! 👋
What are your thoughts on EURUSD?
Following its recent rally, EURUSD has reached a key resistance zone, which also aligns with a trendline. The pair failed to break above this area and has been rejected.
Given the weak momentum and bearish reaction, we do not expect a breakout at

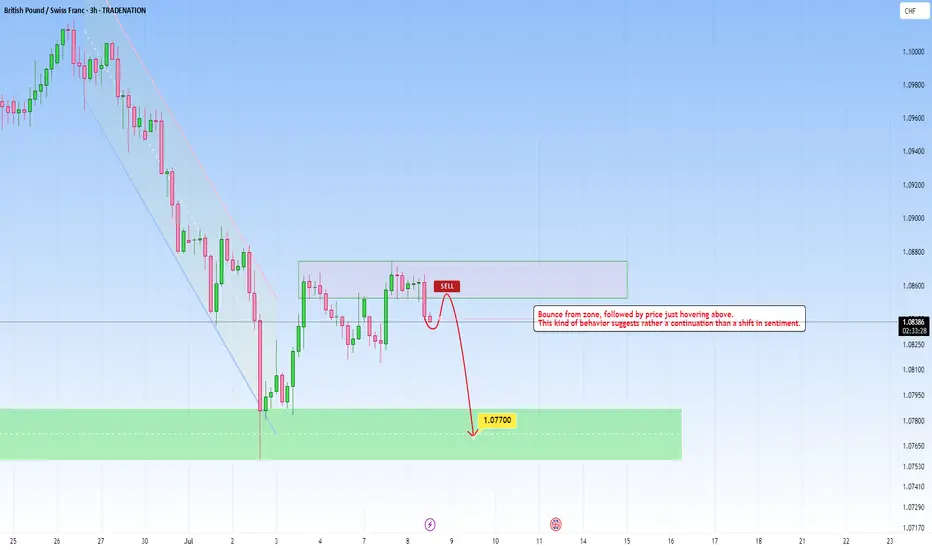
GBPCHF - Continuation Setup towards 1.0770GBPCHF recently descended with strength, and I’ve been watching to see how price reacts here.
Price now hovers above and this is a great indication for us to use for possible continuation move, that could send price into the 1.0770 level.
But if price breaks above with momentum, then I’ll back of
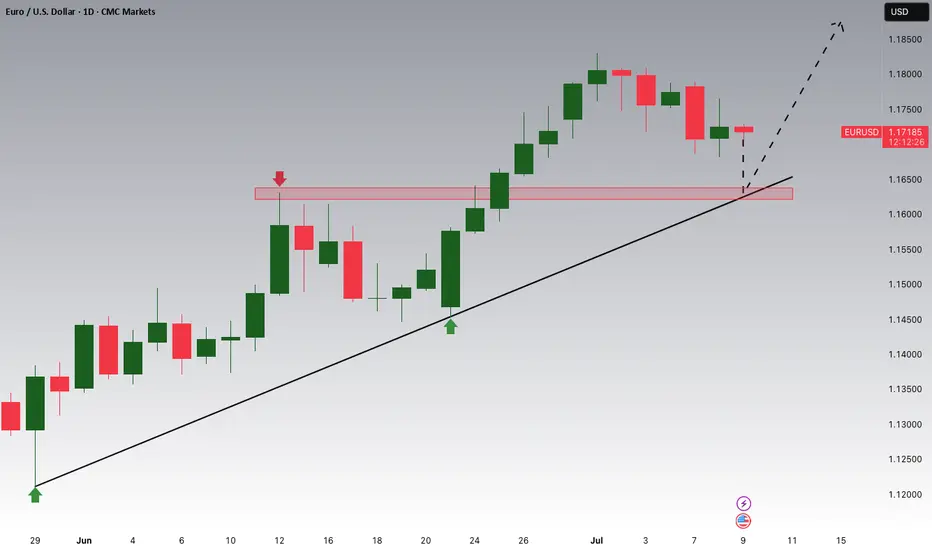
EURO - Price will continue to grow inside rising channelHi guys, this is my overview for EURUSD, feel free to check it and write your feedback in comments👊
Recently, price entered to rising channel, where it soon reached the support level, which coincided with the support area.
After this movement, the price broke this level, but soon turned around and

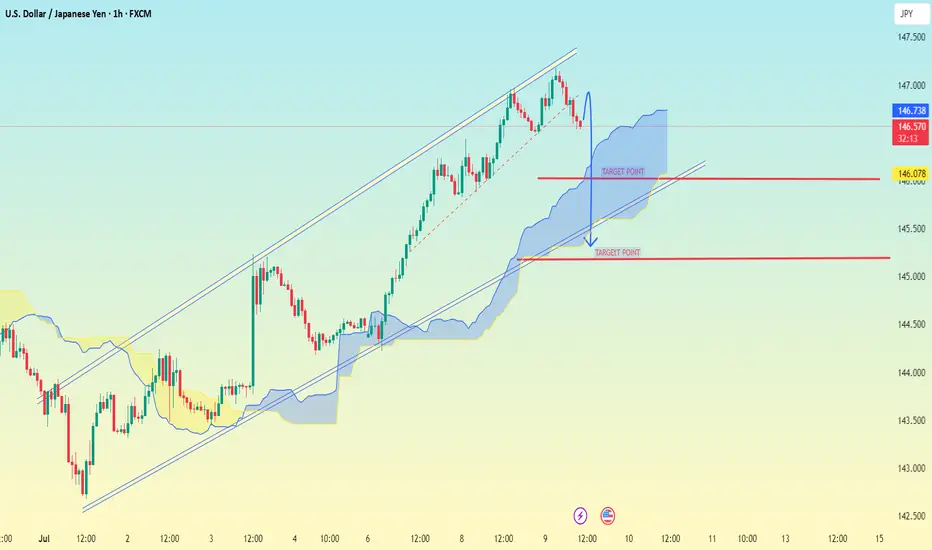
USD/JPY 1H chart PATTERNUSD/JPY 1H chart, the pair has broken below an ascending channel, which is typically a bearish signal. The price is currently inside the Ichimoku cloud, indicating uncertainty, but a breakdown seems likely.
📉 Bearish Target Points:
1. First Target:
✅ 146.078 — Near the bottom edge of the Ichimoku
Lingrid | EURUSD Bullish Trend ContinuesFX:EURUSD is holding a bullish structure inside an upward channel after bouncing from the 1.1670 demand zone. The current retracement appears corrective, and buyers may step in again near the confluence of the trendline and horizontal support. If confirmed, the price is expected to push toward the

See all forex ideas
| - | - | - | - | - | - | - | ||
| - | - | - | - | - | - | - | ||
| - | - | - | - | - | - | - | ||
| - | - | - | - | - | - | - | ||
| - | - | - | - | - | - | - | ||
| - | - | - | - | - | - | - | ||
| - | - | - | - | - | - | - | ||
| - | - | - | - | - | - | - |
News didn't load
Looks like that didn't go very well. Let's try again.
Trade directly on the supercharts through our supported, fully-verified and user-reviewed brokers.


