


Quick updateSP500 and Gold both consolidating, not much action but I think we may see some movement overnight

/
The best trades require research, then commitment.
$0 forever, no credit card needed
Where the world does markets
Join 100 million traders and investors taking the future into their own hands.

Use a Top Down Approach to gather as much CONFLUENCE as possibleAll the information you need to find a high probability trade are in front of you on the charts so build your trading decisions on 'the facts' of the chart NOT what you think or what you want to happen or even what you heard will happen. If you have enough facts telling you to trade in a certain dir

Stocks Have Been in a Bear Market for 25 Years, By This MeasureThe S&P 500 hit a new all-time high in February. However, by one measure it’s been in a bear market all century.
Today’s monthly chart shows SP:SPX as a ratio against gold. Using this comparison, equities have underperformed since Bill Clinton was still President in August 2000.
It illustrates h

The break-up (a must-watch chart)One of the most important—and unusual—developments in the market right now is the combination of rising US bond yields and a falling US dollar.
Normally, when bond yields go up, the dollar strengthens. It's similar to a high-interest bank account: if you can earn more by holding US assets, global i

US10Y Technical Breakdown – Post-Moody’s DowngradeMoody’s has downgraded the US credit rating for the first time since 2011, citing rising debt levels and long-term fiscal challenges.
This move sends a clear warning signal about America’s fiscal path and adds fresh uncertainty to markets already navigating interest rates, inflation, and geopoliti

AUD/USD Sentiment Sours (But There May Better Shorts)Asset managers increased their net-short exposure last week - and as these are 'real money' accounts, they are a group of traders worth listening to. But as always, timing as key, and there may be better setups for bears than AUD/USD over the near term. Today I pick out for AUD crosses to consider.

UJ Could Tumble Back To 140 If Bears Take Expanding RangeToday FX:USDJPY Sellers make a Breakout of the Rising Support of the Expanding Range it's been trading in since the Low that started the range back on April 22nd.
An Expanding Range is typically considered a Continuation Pattern suggesting that if Sellers can hold price under the Rising Support,

Usd/Jpy intra-day Analysis 20-May-2025Disclaimer: easyMarkets Account on TradingView allows you to combine easyMarkets industry leading conditions, regulated trading and tight fixed spreads with TradingView's powerful social network for traders, advanced charting and analytics. Access no slippage on limit orders, tight fixed spreads, ne

5-20-25 WARNING : Bitcoin Sets Up MASSIVE Double-Top WarningI highlighted this incredible price/technical pattern in my morning Plan Your Trade video. But, I thought it was important enough to create a separate video highlighting this incredible Double-Top warning and to try to tell all of my followers to start actively protecting capital over the next 2-3+

3 Reasons Arista Networks Could Soon Rally SignificantlyIn 2023, we covered Arista Networks NYSE:ANET , calling it part of the internet’s "bedrock" but rating it a Hold due to valuation concerns. Since then, ANET has outperformed the S&P 500, proving our call wrong.
Recently, ANET’s stock has dipped alongside broader market declines. However, we belie

See all editors' picks ideas
Trend Volatility Index (TVI)Trend Volatility Index (TVI)
A robust nonparametric oscillator for structural trend volatility detection
⸻
What is this?
TVI is a volatility oscillator designed to measure the strength and emergence of price trends using nonparametric statistics.
It calculates a U-statistic based on the Gini mea

Cointegration Heatmap & Spread Table [EdgeTerminal]The Cointegration Heatmap is a powerful visual and quantitative tool designed to uncover deep, statistically meaningful relationships between assets.
Unlike traditional indicators that react to price movement, this tool analyzes the underlying statistical relationship between two time series and

Bloomberg Financial Conditions Index (Proxy)The Bloomberg Financial Conditions Index (BFCI): A Proxy Implementation
Financial conditions indices (FCIs) have become essential tools for economists, policymakers, and market participants seeking to quantify and monitor the overall state of financial markets. Among these measures, the Bloomberg

TASC 2025.06 Cybernetic Oscillator█ OVERVIEW
This script implements the Cybernetic Oscillator introduced by John F. Ehlers in his article "The Cybernetic Oscillator For More Flexibility, Making A Better Oscillator" from the June 2025 edition of the TASC Traders' Tips . It cascades two-pole highpass and lowpass filters, then sca

Dynamic Volume Clusters with Retest Signals (Zeiierman)█ Overview
The Dynamic Volume Clusters with Retest Signals indicator is designed to detect key Volume Clusters and provide Retest Signals. This tool is specifically engineered for traders looking to capitalize on volume-based trends, reversals, and key price retest points.
The indicator seamles

Multi-Layer Volume Profile [BigBeluga]A powerful multi-resolution volume analysis tool that stacks multiple profiles of historical trading activity to reveal true market structure.
This indicator breaks down total and delta volume distribution across time at four adjustable depths — enabling traders to spot major POCs, volume shelves,

pymath█ OVERVIEW
This library ➕ enhances Pine Script's built-in types (`float`, `int`, `array`, `array`) with mathematical methods, mirroring 🪞 many functions from Python's `math` module. Import this library to overload or add to built-in capabilities, enabling calls like `myFloat.sin()` or `myIntArra

Best SMA FinderThis script, Best SMA Finder, is a tool designed to identify the most robust simple moving average (SMA) length for a given chart, based on historical backtest performance. It evaluates hundreds of SMA values (from 10 to 1000) and selects the one that provides the best balance between profitability,

Bitcoin Monthly Seasonality [Alpha Extract]The Bitcoin Monthly Seasonality indicator analyzes historical Bitcoin price performance across different months of the year, enabling traders to identify seasonal patterns and potential trading opportunities. This tool helps traders:
Visualize which months historically perform best and worst for

Market Manipulation Index (MMI)The Composite Manipulation Index (CMI) is a structural integrity tool that quantifies how chaotic or orderly current market conditions are, with the aim of detecting potentially manipulated or unstable environments. It blends two distinct mathematical models that assess price behavior in terms of bo

See all indicators and strategies
News didn't load
Looks like that didn't go very well. Let's try again.
Community trends
TSLA PRICE ACTION 21st MAY 2025This is the updated price action of Tesla. I have clearly discussed the new buying levels & have also discussed why I sold it.
If you have any questions, feel free to leave a comment or DM me.
NOTE: AVOID OPTIONS IN TESLA

$NVTS is up 125%, but they might not be done yet!NASDAQ:NVTS Could see more upside if...
We close the week above $4.66 Double Bottom Breakout. This would lead us to the following targets...
🎯$6📏$7.76
- Bullish cross on H5_L indicator
- Volume shelf launch with GAP
- NASDAQ:NVDA Partnership
- Small Cap
- High Short Float

MARA, has potential upside of roughly 180%.With cryptocurrencies on the brink of a powerful rally, now is an ideal time to initiate a position in Marathon Digital Holdings (NASDAQ: MARA), which we project has upside potential of approximately 180%. As Bitcoin and other digital assets regain momentum, demand for large-scale mining capacity wi

Strategy Set To Drop —Selling Bitcoin?If you knew a stock was going to crash but this stock is related to Bitcoin and always moves with Bitcoin but now is about to detach, would you tell others?
Bitcoin is already trading at a new All-Time High and six weeks green. Ok, let's forget about Bitcoin because this is about MicroStrategy (now

AAPL SwingYou can get in when it hits the trend support line then get out when it's in that resistance zone.

Nu Flag breakoutNU given flag break out and also retested channel breakout hope it will make new highs in future
Nu Holdings Ltd. (NYSE: NU), the parent company of Nubank, is a leading digital banking platform in Latin America, operating primarily in Brazil, Mexico, and Colombia. As of May 22, 2025, the stock tra

MSTR/IBIT line on the sand?Is this the line in the sand that M. Saylor is looking on timing some of the ATM? We might be getting there soon MSTR

$MSTR ATM SHORT to $285.00Darkpools data show a distribution zone with limit orders propping in the upper 200s.

Strategy Finished Consolidating, New High With BTC Leading MicroStrategy (MSTR), the stock is currently demonstrating significant volatility and a strong correlation with Bitcoin's price movements, acting almost like a leveraged play on the cryptocurrency.
From a charting perspective, MSTR has been in a long-term bullish trend since its pivot to a Bitcoin

AAP to $40-43 on positive earnings report in 2 days?1. Fundamentals
The company was beaten down because of losing competition. This is a retail auto parts store chain, and not az OEM supplier.
The company presented a relatively good 2024 Q4 earnings in February, but fell on weak guidance.
Insiders bought shares in 2025 March
They completed a re

See all stocks ideas
Today
FROFrontline Plc
Actual
0.15
USD
Estimate
0.19
USD
Today
BKEBuckle, Inc. (The)
Actual
0.70
USD
Estimate
0.69
USD
Today
BAHBooz Allen Hamilton Holding Corporation
Actual
1.61
USD
Estimate
1.62
USD
Today
SLGLSol-Gel Technologies Ltd.
Actual
−3.20
USD
Estimate
−1.25
USD
Today
MPUMega Matrix Inc.
Actual
—
Estimate
—
Today
CODID/B/A Compass Diversified Holdings Shares of Beneficial Interest
Actual
—
Estimate
0.46
USD
Today
AVDAmerican Vanguard Corporation
Actual
—
Estimate
−0.03
USD
Today
UVVUniversal Corporation
Actual
—
Estimate
—
See more events
Community trends
Bitcoin Be Setting Bull Trap?_Breakout Without High VolumeBitcoin ( BINANCE:BTCUSDT ) started to fall yesterday after forming a new All-Time High(ATH) with high volume , but started to rise again. One of the reasons for Bitcoin’s sudden drop yesterday was the sharp drop in the S&P 500 ( SP:SPX ) index .
First of all, I must say that Bitcoin’s situ

ETHUSD Break- Test- GO!!!This is a classic break-test go setup. What you want to see is a hook-down. What you don't want to see is push-back into the structure.
It's that simple.
Boost, like, follow, subscribe!

TradeCityPro | Bitcoin Daily Analysis #98👋 Welcome to TradeCity Pro!
Let’s dive into the Bitcoin and major crypto indices analysis. As usual, I’ll walk you through the New York futures session triggers.
⏳ 1-Hour Timeframe
As you can see, the price has finally broken above the 106422 resistance, and after some pullbacks to that level, it c

BTC - Can BTC push past $109k in this rising channel?Bitcoin has been trading within a clearly defined upward channel since the beginning of April. This rising channel is characterized by three touchpoints on both the upper and lower trendlines, indicating a consistent pattern of price movement within these boundaries.
Approaching key resistance
Cu

Bitcoin - Here we have the all time high!Bitcoin - CRYPTO:BTCUSD - is just getting started:
(click chart above to see the in depth analysis👆🏻)
It was really just a matter of time until we see a new all time high on Bitcoin. Consindering that over the past two months alone, Bitcoin rose another +50%, this was a clear indication that b

BTCUSD NEXT MOVE (EXPECTING MILD CORRECTION)(23-05-2025)Go through the analysis carefully, and do trade accordingly.
Anup 'BIAS for BTCUSD (23-05-2025) (SHORT TERM)
Current price- 1111000
"if Price stay below 1,12,000 then next target is 1,10,000, 1,08,000 and 1,06,000 above that 1,13,000.
-POSSIBILITY-1
Wait (as geopolitical situation are worsening

SUI/USDT Potential UpsidesHey Traders, in today's trading session we are monitoring SUI/USDT for a buying opportunity around 3.85 zone, SUI/USDT is trading in an uptrend and currently is in a correction phase in which it is approaching the trend at 3.85 support and resistance area.
Trade safe, Joe.

Bitcoin may break support level and fall to support lineHello traders, I want share with you my opinion about Bitcoin. In this chart, we can see how the price a few moments ago declined, but then turned around and started to grow inside an upward wedge. Price at once rebounded from the support line of the wedge and made an upward impulse to the support l

BITCOIN is attempting to converge with past Cycles!Bitcoin (BTCUSD) is experiencing the weakest Bull Cycle in its history, a natural product of the Theory of Diminishing Returns (TDM).
This chart couldn't have put it better as we show all Cycles since BTC's first day, one on top of the other. Naturally the first Cycles were the most aggressive, wit

BTC Macro Cycle Still Intact Key Retest Zone Before Final LegBTCUSDT has sustained a well structured bullish formation since early 2024, consistently reacting to key trendline levels with precision. The initial major impulse started from the $38,545 region, rallying towards the $73,660 high, where the market faced rejection and confirmed a critical resistance

See all crypto ideas
GOLD → Consolidation (correction) ahead of newsFX:XAUUSD is testing resistance at 3346 and forming a correction, leaving liquidity above the level as the current target. The correction was influenced by the dollar. What can we expect next?
Gold is rising for the fourth day in a row and is approaching $3350, awaiting US PMI data. The dollar

XAU/USD 1h pattern.I'm planning a *buy trade on XAUUSD (Gold) from 3290 with a target at 3400*. Let's analyze this trade setup:

XAUUSD[GOLD]: Bearish Correction Is Happening! Gold rejected at 3350, dropping almost 600 pips to 3290. We can expect the price to drop further to around 3250, potentially reversing from there. A possible entry point is 3304, followed by a drop from there.
If you’d like to contribute, here are a few ways you can assist us:
- Like our ideas
- C

GOLD ROUTE MAP UPDATEHey Everyone,
Another strong day in the markets!
After hitting our bullish targets at 3236, 3278, and 3308 earlier this week, yesterday we identified and stated that we have EMA5 cross and lock above 3308, opening the move to 3343.
- 3343 target was reached with precision, completing the move as

GOLD trending higher: Can buyers push towards 3,350$?Right now OANDA:XAUUSD is a classic case of a market trading within an ascending channel, with price action consistently respecting both its upper and lower borders.
The price has broken above a clear resistance zone and may pull back for a retest. This area also happens to coincide with the gol

Hellena | GOLD (4H): LONG to resistance area of 3439.37.Colleagues, Last time, I suggested that the five-wave movement was not yet complete. It seems that this is indeed the case.
Wave "5" of the higher degree is unfolding, and I expect the price to reach the resistance area around 3439.37, which marks the top of wave "X".
Within the smaller five-wave st

Gold (XAU/USD) Bullish Trade Setup – Breakout in ProgressTrend Overview
📈 Uptrend in Progress
Price is moving within an ascending channel:
🔵 Support Line (bottom of channel)
🔺 Resistance Line (top of channel)
Key Levels
Current Price:
● 3,337.53 (📍)
Trade Idea (Long Setup):
🔵 Entry Zone
● 3,306.85 – 3,302.98
(Wait for pullback into this area)
🟦 R

Lingrid | GOLD bullish BREAKOUT from Downward ChannelOANDA:XAUUSD is retesting the broken trendline from above while consolidating just above the key $3,300 level. A successful bounce from this zone could ignite a rally toward the next resistance at $3,382, breaking the recent lower high structure. However, the market remains sensitive to any fake br

Gold Retests Broken Resistance – Is the PRZ Next?As I expected in the previous IDEA , Gold ( OANDA:XAUUSD ) managed to break the Resistance zone($3,280-$3,245) and touched the first target .
Gold appears to be completing a pullback to the Resistance zone($3,280-$3,245) .
On my chart , the Resistance zone($3,280-$3,245) is currently l

OIL: A Bearish Setup And Geopolitical UncertaintyOIL: A Bearish Setup And Geopolitical Uncertainty
Today Oil is showing a clear bearish pattern development but it comes with a high risk from a fundamental perspective.
Technical analysis:
The price faced a strong resistance near 64 - 64.80 from where it moved down several times. The Chart is sho

See all futures ideas
GBP/USD - Triangle Breakout (23.05.2025)The GBP/USD pair on the M30 timeframe presents a Potential Buying Opportunity due to a recent Formation of a Triangle Pattern. This suggests a shift in momentum towards the upside and a higher likelihood of further advances in the coming hours.
Possible Long Trade:
Entry: Consider Entering A Long

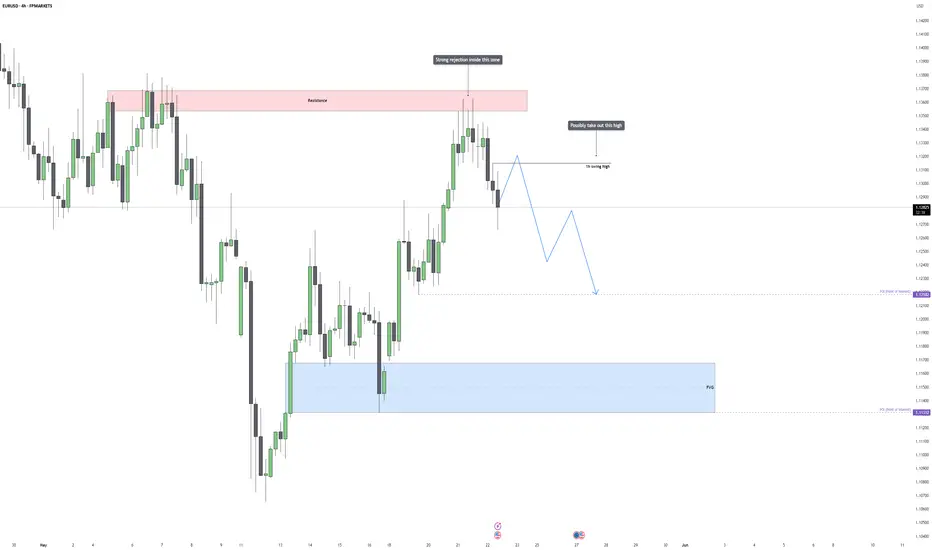
EURUSD: at key resistance: Will price rebound to 11300?Quick recap on EURUSD, seriously déjà vu of my previous analysis on EURUSD - once again we see the price coming towards the same resistance level. This is a level where it has struggled to break through and reversed nicely to the downside as expected. For me it's definitely one to monitor, especial

EURUSD – Bearish Outlook After Inducement and RejectionEURUSD recently delivered a sharp rejection from the 1.13700 resistance zone, a level that previously acted as a strong barrier for price. This area had already shown signs of supply in the past, and the latest reaction only strengthens the case for continued bearish interest at that level. The reje
EUR/USD...EURUSD 30M CHART PATTERN..I'm planning a *EUR/USD sell trade* with the following details:
- *Entry Price*: 1.13300
- *Take Profit (TP) Levels*:
- *TP1: 1.12300 (-100 pips*)
- *TP2: 1.11400 (-190 pips*)
### Key Considerations:
1. *Risk Management*:
- Ensure you have a *stop-loss (SL)* in place (e.g., 1.1380

USD/JPY Long Trade Setup – Key Support Rebound Targeting 148.674Entry Point:
Price: 143.373
The chart suggests initiating a long (buy) position at this level, which is just slightly below the current market price.
Stop Loss:
Price: 141.707
Positioned below a strong support zone. This level protects the trade from excessive downside risk if the price breaks

EUR/USD 2H CHART PATTERNThis EUR/USD 2-hour chart illustrates a bearish flag pattern, signaling a potential continuation of the prior downtrend. After a sharp drop, price consolidated within an upward-sloping channel, forming the flag. The pattern suggests weakening bullish momentum as the price reached a resistance zone a

NZDJPY will continue to fall after false breakout NZDJPY is correcting after the support breakout. The purpose of such correction is to provoke bullish liquidity before the fall. There is a magnet on the market - liquidity in the zone 85.08 - 85.27. False breakout will return the market to the downward phase
Scenario: growth to local resistance,

UJ Could Tumble Back To 140 If Bears Take Expanding RangeToday FX:USDJPY Sellers make a Breakout of the Rising Support of the Expanding Range it's been trading in since the Low that started the range back on April 22nd.
An Expanding Range is typically considered a Continuation Pattern suggesting that if Sellers can hold price under the Rising Support,
Use a Top Down Approach to gather as much CONFLUENCE as possibleAll the information you need to find a high probability trade are in front of you on the charts so build your trading decisions on 'the facts' of the chart NOT what you think or what you want to happen or even what you heard will happen. If you have enough facts telling you to trade in a certain dir
EURUSD – Buy to Mega Resistance 1.2455 (then SELL BIG)💹📊 EURUSD – Buy to Mega Resistance 1.2455 (then SELL BIG) 🧨🔮
The EURUSD is marching toward history once again—right into the jaws of the 1.2455 Mega Resistance (descending level-approximate target). As always, the structure tells the story.
📈 What we’re seeing now is the third peak of a massive, d

See all forex ideas
| EUR | USD | GBP | JPY | AUD | CAD | |||
|---|---|---|---|---|---|---|---|---|
| EUR | - | - | - | - | - | - | - | |
| USD | - | - | - | - | - | - | - | |
| GBP | - | - | - | - | - | - | - | |
| JPY | - | - | - | - | - | - | - | |
| CHF | - | - | - | - | - | - | - | |
| AUD | - | - | - | - | - | - | - | |
| CNY | - | - | - | - | - | - | - | |
| CAD | - | - | - | - | - | - | - |
Trade directly on the supercharts through our supported, fully-verified and user-reviewed brokers.


