Gold Takes the Throne as Safe Haven AgainThe recent escalation in the Middle East — particularly Israel’s surprise strike on Iran — has stirred up significant volatility in global financial markets. Oil prices surged, stock markets around the world turned red, just as many had predicted. However, in a surprising twist, capital did not rush

The best trades require research, then commitment.
Get started for free$0 forever, no credit card needed

Scott "Kidd" PoteetThe unlikely astronaut

Where the world does markets
Join 100 million traders and investors taking the future into their own hands.

EUR/USD: Euro Pops Above $1.16 in Four-Year High. What’s Next?The dollar wobbles, Trump talks tariffs, and the euro’s got its dancing shoes on.
The Euro Wakes Up, Stretching Its Legs at $1.16
Look who just rolled out of bed and decided to make a scene.
For the first time in four years, the euro has finally leapt out of its slumber and sprinted to $1.16 —

ETHEREUM: THE NEW BOND OF THE DIGITAL WORLDPrice isn’t the goal. Price is the side effect.
Meanwhile, BlackRock - a black hole with a trust-backed logo - just absorbed 42,000 ETH more.
Yesterday, you may have read this "regular" headline:
BlackRock increases its Ethereum exposure to $4 billion, adding $109.5 million via ETFs.
But here’s w

Silver surge has more bullish upsideSilver is breaking out. Its strength is no accident. The US is running a structural deficit north of 6% of GDP in a full-employment economy. The bond market has absorbed the pain so far, but pressure is building. Investors are starting to look for insurance. Silver is one of the cleanest ways to pl

Soaring platinum breaks a 3 year high at $1,152.50/ozChina, the world’s largest consumer of platinum, imported its highest amount in a year last month. Retail investment demand (bars and coins) in China more than doubled, overtaking North America as the top market for platinum investment.
Analysts at Bloomberg Intelligence predict that global platinum

Elon Musk vs Trump: Who you betting on?Elon Musk and Donald Trump have recently had a public falling-out, with their feud playing out on social media and in political circles.
The dispute seems to have started over Trump's new budget bill, which Musk has criticized for increasing the national debt. Trump, in turn, accused Musk of being

OptionsMastery: Inverse head and shoulders on UAL! 🔉Sound on!🔉
📣Make sure to watch fullscreen!📣
Thank you as always for watching my videos. I hope that you learned something very educational! Please feel free to like, share, and comment on this post. Remember only risk what you are willing to lose. Trading is very risky but it can change your life!

The MSCI World index sets a new all-time record!The MSCI World stock market index set a new all-time record during the trading session of Monday June 2, wiping out the entire stock market shock of February/March, which saw the global equity market lose 20%. This technical signal still needs to be confirmed at the end of the week at the next weekl

USDJPY forms textbook head and shoulders patternOur last bearish call on USDJPY played out perfectly. Now, a new setup is forming. With US ISM data showing contraction and stock markets under pressure, the dollar-yen could be next to drop. Watch as we break down the textbook head and shoulders pattern and the levels to watch for a potential 600+

Do bulls have enough steam to drive gold higher?A lot of things to consider this week, a lot of data and geopolitical tensions. Will the economic uncertainty and potential bad US jobs data drive TVC:GOLD higher? Let's dig in.
FX_IDC:XAUUSD
Let us know what you think in the comments below.
Thank you.
77.3% of retail investor accounts lose

See all editors' picks ideas
ATR RopeATR Rope is inspired by DonovanWall's "Range Filter". It implements a similar concept of filtering out smaller market movements and adjusting only for larger moves. In addition, this indicator goes one step deeper by producing actionable zones to determine market state. (Trend vs. Consolidation)
>

Langlands-Operadic Möbius Vortex (LOMV)Langlands-Operadic Möbius Vortex (LOMV)
Where Pure Mathematics Meets Market Reality
A Revolutionary Synthesis of Number Theory, Category Theory, and Market Dynamics
🎓 THEORETICAL FOUNDATION
The Langlands-Operadic Möbius Vortex represents a groundbreaking fusion of three profound mathematic

Risk-Adjusted Momentum Oscillator# Risk-Adjusted Momentum Oscillator (RAMO): Momentum Analysis with Integrated Risk Assessment
## 1. Introduction
Momentum indicators have been fundamental tools in technical analysis since the pioneering work of Wilder (1978) and continue to play crucial roles in systematic trading strategies (Jeg

TrendMaster Pro 2.3 with Alerts
Hello friends,
A member of the community approached me and asked me how to write an indicator that would achieve a particular set of goals involving comprehensive trend analysis, risk management, and session-based trading controls. Here is one example method of how to create such a system:
Core

Support and Resistance Logistic Regression | Flux Charts💎 GENERAL OVERVIEW
Introducing our new Logistic Regression Support / Resistance indicator! This tool leverages advanced statistical modeling "Logistic Regressions" to identify and project key price levels where the market is likely to find support or resistance. For more information about the proc

Mandelbrot-Fibonacci Cascade Vortex (MFCV)Mandelbrot-Fibonacci Cascade Vortex (MFCV) - Where Chaos Theory Meets Sacred Geometry
A Revolutionary Synthesis of Fractal Mathematics and Golden Ratio Dynamics
What began as an exploration into Benoit Mandelbrot's fractal market hypothesis and the mysterious appearance of Fibonacci sequences i

EMD Trend [InvestorUnknown]EMD Trend is a dynamic trend-following indicator that utilizes Exponential Moving Deviation (EMD) to build adaptive channels around a selected moving average. Designed for traders who value responsive trend signals with built-in volatility sensitivity, this tool highlights directional bias, market

Bear Market Probability Model# Bear Market Probability Model: A Multi-Factor Risk Assessment Framework
The Bear Market Probability Model represents a comprehensive quantitative framework for assessing systemic market risk through the integration of 13 distinct risk factors across four analytical categories: macroeconomic indic

Range Filter [DW]This is an experimental study designed to filter out minor price action for a clearer view of trends.
Inspired by the QQE's volatility filter, this filter applies the process directly to price rather than to a smoothed RSI.
First, a smooth average price range is calculated for the basis of the fil

Delta Volume Columns Pro [LucF]█ OVERVIEW
This indicator displays volume delta information calculated with intrabar inspection on historical bars, and feed updates when running in realtime. It is designed to run in a pane and can display either stacked buy/sell volume columns or a signal line which can be calculated and dis

See all indicators and strategies
News didn't load
Looks like that didn't go very well. Let's try again.
Community trends
Gold silver the es and the Russell Friday 13 there's no time to have a long discussion here the information is in the video important things are happening in these markets and they are explained in the video. there are some changes suggesting that the silver may not actually go lower at this point even though the gold is hold

Big GAP Down to buyBuy oportunity I think. MA 100 and 200 almost flat on W timeframe, BIG GAP down to be close.

Why NuCana (NCNA) Stock Might Rally
NuCana (NCNA) has seen a significant surge in its stock price, jumping 77.69% in a single trading session. Here are a few reasons why NCNA might continue its upward momentum:
Recent Financial Improvements – NuCana reported reduced Q1 2025 losses, signaling potential financial stabilization.
Clini

Time to buy? Too much negative press. Buy in Fear- Updated 13/6Apple has faced a significant amount of negative press recently, which has created a lot of fear and critical perceptions. This situation indicates that in times of fear, you should buy, and in times of greed, you should sell. As a result, I have taken a substantial long position on Apple.
The flag

Cisco’s Charts Are Painting a Conflicting PictureCisco Systems NASDAQ:CSCO lost some ground in recent days even as the tech giant kicked off its Cisco Live 2025 event this week in San Diego, and the stock’s charts are flashing some conflicting signals. Let’s take a look.
Cisco’s Fundamental Analysis
CSCO’s three-day Cisco Live event began Mo

NFLX Short Setup: Bear Flag Break and Retest""
Simple Breakdown:
Pattern: Bear flag breakdown + lower high
Entry: $1,215.08 (break + retest zone)
Stop Loss: $1,230.02 (above recent high)
Target: $1,174.41 (prior support zone)
Risk/Reward: Approx. 1:2.7 ✅

ORCL IS A SELL SELL SELL HERE! way overbought!ORCL sell the news on this rally! Breached an all time high running out of steam. As most traders know a new ATH is heavy resistance, and we usually "check back" underneath this level once breaching in some cases they will go higher (after a correction). This combined with screaming overbought in

Tesla’s Flat Deception: Bearish Wave Y in the Making?Tesla’s price structure has taken traders on quite a journey, and after peeling back the layers, it's clear that both bullish and bearish possibilities demanded attention — but only one holds more weight for now.
The first sign of life came at the March low, where price made a lower low (218.13 to

Amd - This starts the next +200% rally!Amd - NASDAQ:AMD - is preparing a major rally:
(click chart above to see the in depth analysis👆🏻)
It has - once again - not been unexpected at all that we now see a major reversal rally on Amd. After the harsh drop of about -65%, Amd retested a significant confluence of support and already cre

AAPL breakout coming soonWhich way will it squeeze? I share my thoughts if AAPL can hold above 200.
*technically showing caution signs (bearish, but can flip)
*news is affecting the market greatly (esp AAPL re: tarriffs)
*RSI & MACD need a positive signal
*204, 205, 208 immediate targets to be focused on imo
Have a great

See all stocks ideas
Jun 16
PODCPodcastOne, Inc.
Actual
—
Estimate
−0.04
USD
Jun 16
CRWSCrown Crafts, Inc.
Actual
—
Estimate
—
Jun 16
AIOTPowerFleet, Inc.
Actual
—
Estimate
−0.02
USD
Jun 16
CODACoda Octopus Group, Inc.
Actual
—
Estimate
0.03
USD
Jun 16
GLBSGlobus Maritime Limited
Actual
—
Estimate
−0.09
USD
Jun 16
APPSDigital Turbine, Inc.
Actual
—
Estimate
0.04
USD
Jun 16
RFILRF Industries, Ltd.
Actual
—
Estimate
0.04
USD
Jun 16
LENLennar Corporation
Actual
—
Estimate
1.94
USD
See more events
News didn't load
Looks like that didn't go very well. Let's try again.
Community trends
Bitcoin - Bears vs Bulls: $100k next?Price recently tapped into a well-defined 4H and daily resistance zone and was met with an immediate rejection. That rejection wasn’t just a reaction, it led to a confirmed market structure shift as price broke the previous low. This transition from higher highs to a lower low signals the first sign

Bitcoin, Good News & Good News —Bullish Confirmed (Retrace Over)First, the good news is that we have a higher low and a strong recovery in place. The current candle has a long lower wick and is already trading green, at the top of the session.
The second good news is how far down the retrace went. Last time Bitcoin bottomed around $100,300, this time the bottom
Ethereum - This structure decides everything!Ethereum - CRYPTO:ETHUSD - trades at a key structure:
(click chart above to see the in depth analysis👆🏻)
After Ethereum retested the previous all time high in the end of 2024, we saw quite a harsh move lower. This move was followed by an expected recovery, however Ethereum is still trading bel

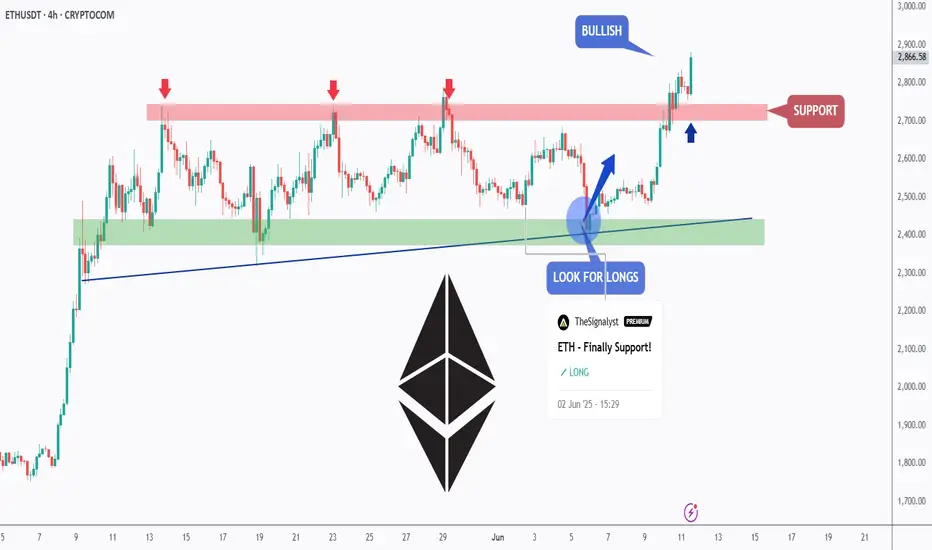
ETH - Medium-Term Bulls Confirmed Control!Hello TradingView Family / Fellow Traders. This is Richard, also known as theSignalyst.
📈 As per our previous ETH analysis (shown on the chart), ETH rejected the green support zone and pushed higher, reaching our target near $2,750.
What’s next?
After breaking above the $2,750 structure marked
Btc Short position Btc short position frame 15 min
Waiting the confirmation and sell
Flag pattern at 15 min

UNI to the Mooni - Unleashing Banking into DeFi - Send itUniswap has powered trillions of dollars of exchange volume over the years, but, while its achieved economies of scale, it's been held back from mainstream use and value accrual due to the existing banking system's de facto and now uncovered to be de jure prohibition on interaction and SEC's sys

DEEPBOOK Spot Buy IdeaDEEP/USDT SPOT - 1D - BYBIT
Current Price: 0.14727 (Close)
24h Range: 0.13600 (Low) → 0.15582 (High)
Change: -5.47% (▼0.00853)
🔥 Extremely Bullish on DEEP!
Falling Wedge Pattern confirmed—breakout incoming!
If you’re not holding yet, consider buying at market price.
🎯 Tar

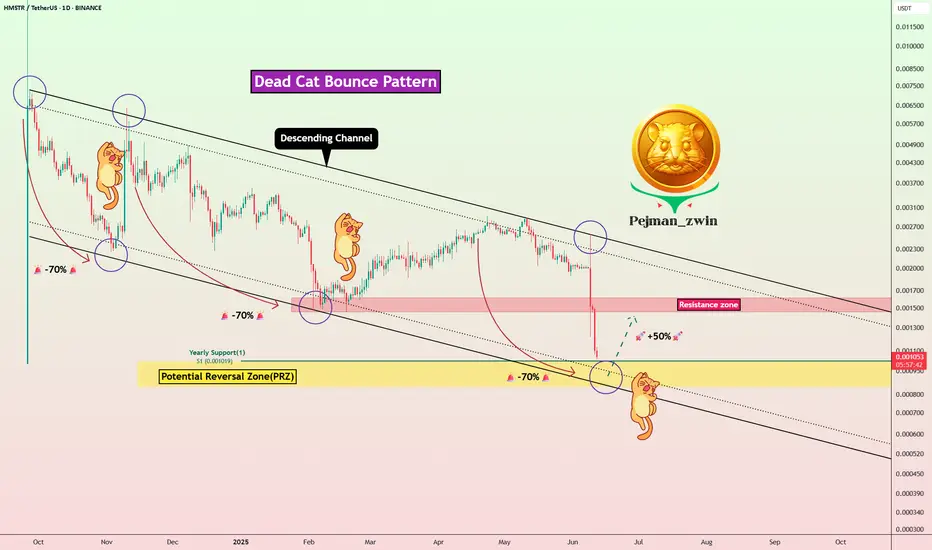
Dead Cat Incoming? HMSTR Eyes +50% Rebound Before Full MeltdownToday, let’s take a look back at HMSTR( BINANCE:HMSTRUSDT ), the token from the Telegram game Hamster Kombat .
While the game quickly gained global popularity and attracted massive user attention, it unfortunately seems to be failing — and may already be on the path to collapse .
Let’s break
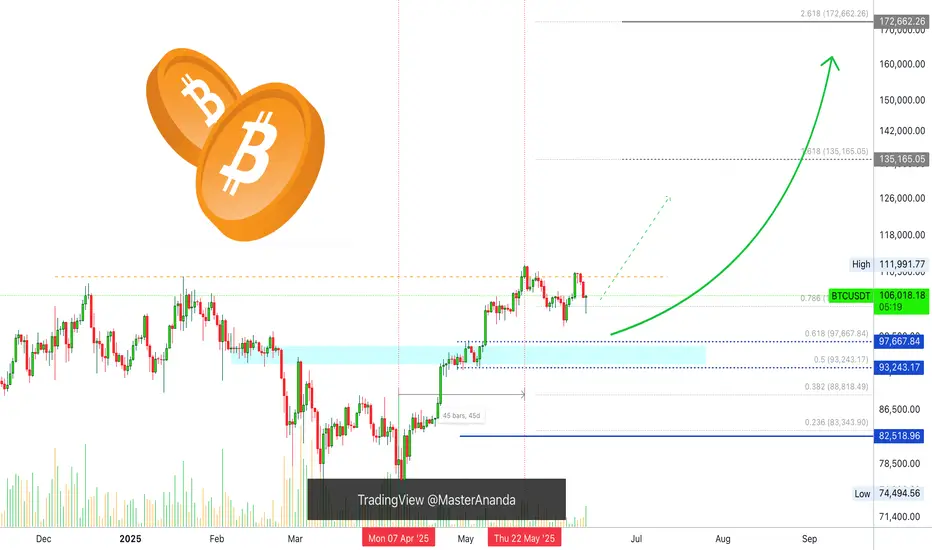
BTCUSDEventually anything goes up sooner or later goes down especially speculative and high liquidity market this is the system or core process and nothing is impossible.
Again, it's just simple prediction based on simple technical analysis there are so many other factors involve where to market would b

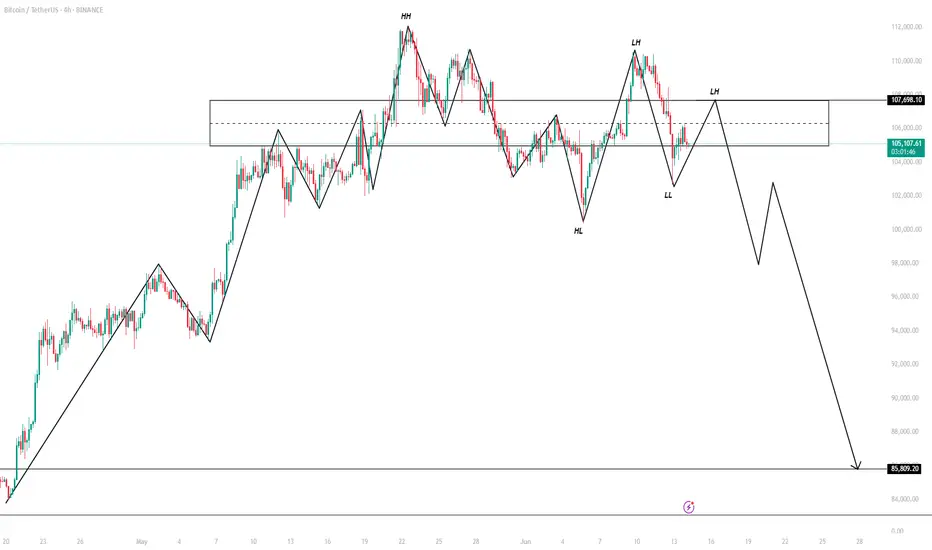
BTC AT DEEP CORRECTION Price failed to break and hold above 111,000, forming a double top or potential lower high structure. Strong bearish drop from 111,000 to 103,500, showing momentum shift to the downside. Likely stop-hunt or liquidity grab below prior lows , Next move will depend on whether it breaks above 107k (bull
See all crypto ideas
News didn't load
Looks like that didn't go very well. Let's try again.
GOLD → Geopolitical risks are driving gold prices up. To ATH?FX:XAUUSD is updating its interim highs as it retests resistance at 3435 amid escalating tensions in the Middle East. Economic risks are on the rise...
Gold rose 1.5% on Friday in Asian trading as investors sought refuge from escalating tensions between Israel and Iran. The price approached 7-

GOLD ROUTE MAP UPDATEHey Everyone,
Great finish after completing each of our targets throughout the week with ema5 lock confirmations on our proprietary Goldturn levels. Yesterday we finished off with 3388 and stated we would look for ema5 cross and lock above 3388 to open 3428 and failure to lock will follow with a re

Update of the Bullish/Bearish Catalysts for Gold prices________________________________________
⚡️ Gold’s Pullback: A Reset, Not the End
After peaking above $3,500/oz in April, gold’s slide back toward $3,210 marks a sharp—but not unusual—correction. What’s changed in the gold narrative? The rapid unwinding of panic bids as the Fed stays hawkish, the do

Lingrid | GOLD bullish Extension from the KEY Support ZoneOANDA:XAUUSD is climbing within a clean upward channel after rebounding strongly from the 3338 zone and forming higher lows. The recent breakout above the 3398.4 area signals a trend continuation setup toward the resistance line near 3465. Price is now testing the broken trendline from above, whic

Trading Signals for Gold Sell below $3,443 (21 SMA -7/8 Murrray)The XAU/USD trend remains bullish as long as the price consolidates above 3,384.
Therefore, it would be prudent to buy gold as long as the price consolidates above3,444, where the 7/8 Murray level is located.
Gold's volatility will continue over the next few days, so we believe it could move betwe

Gold Takes the Throne as Safe Haven AgainThe recent escalation in the Middle East — particularly Israel’s surprise strike on Iran — has stirred up significant volatility in global financial markets. Oil prices surged, stock markets around the world turned red, just as many had predicted. However, in a surprising twist, capital did not rush
SILVER (#XAGUSD): Strong Bullish Move Ahead?!It appears we've seen a legitimate liquidity grab following a test of a crucial daily/intraday structure on 📈SILVER.
After a false breakout of the highlighted area, the price rebounded and broke through a significant downward trend line and a minor horizontal resistance on the 4H chart.
I believ

Chart Pattern Analysis Of Bitcoin
There are 4-5 candles consolidate around the resistance,
And the demands keep decreasing.
Compared to K3,
the demand at K4 increased, but it failed to close upon K3.
If K5 is a doji candle close at low price area,
Or,If K5 starts with a bear gap to close below K4,
It is likely that the following

Gold will grow a little more and then make correctionHello traders, I want share with you my opinion about Gold. After forming a downward wedge and several rejections near the support line, the price eventually broke out to the upside, signaling a reversal. This breakout was followed by a strong upward impulse, and Gold quickly shifted into a consolid

GOLD - Price can correct to support level and then bounce upHi guys, this is my overview for XAUUSD, feel free to check it and write your feedback in comments👊
Gold entered a Rising Channel structure, demonstrating stable growth with higher highs and higher lows.
After testing and breaking through the $3265 support level, the price pulled back slightly and

See all futures ideas
News didn't load
Looks like that didn't go very well. Let's try again.
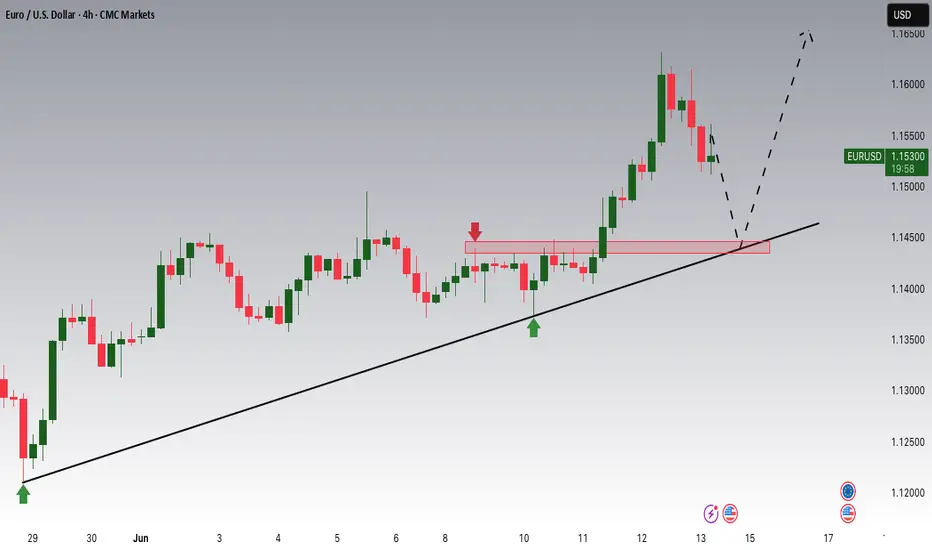
EURUSD Potential UpsidesHey Traders, in today's trading session we are monitoring EURUSD for a buying opportunity around 1.14500 zone, EURUSD is trading in an uptrend and currently is in a correction phase in which it is approaching the trend at 1.14500 support and resistance area.
Trade safe, Joe.
Euro can reach resistance line of channel and make correctionHello traders, I want share with you my opinion about Euro. Previously, price was trading inside a downward channel, gradually declining from the resistance line while forming a series of lower highs and lower lows. During that phase, sellers were clearly in control, and every attempt to grow was me

USD/CAD.1week chart pattern.It looks like me discussing a trade setup for USD/CAD with:
Sell Entry: 1.36200
Target Point 1: 1.23504
Target Point 2: 2.31000 ← This seems like a mistake
Let’s break it down:
---
🔍 Trade Analysis:
Sell at 1.36200: This is a reasonable short entry, near recent resistance (depending on curr

EUR/USD Bulls in Control... But the Trap Is Set at 1.1600? 🇺🇸 EUR/USD – Technical & Macro Outlook
EUR/USD has posted an impressive rally over the past few weeks, driven by a combination of technical and macro factors. It is currently trading around 1.1586, right at the edge of a major supply zone where previous sharp rejections and reversals have taken pl

EUR/USD - Daily highs taken, now what?Introduction
The EUR/USD made a strong move higher today, establishing a clear uptrend on the 4-hour chart. With this latest push, it swept the daily liquidity above the previous high. The question now is whether the EUR/USD will continue moving higher or if there are opportunities for long entries

USDJPY Poised for a BreakoutUSDJPY Poised for a Breakout
On the 4-hour chart, USDJPY is not yet taking a clear direction. The price is showing the possibility of both movements.
With the current data we can see that USDJPY is forming a triangle pattern and only the breakdown up or down will show the direction of the price.

EURUSD: Will Go Up! Long!
My dear friends,
Today we will analyse EURUSD together☺️
The recent price action suggests a shift in mid-term momentum. A break above the current local range around 1.15537 will confirm the new direction upwards with the target being the next key level of 1.15800 and a reconvened placement of

EURGBP draws a false breakoutExit from consolidation provokes distribution and price growth by 1%, the daily ATR is exhausted. The currency pair is forming a false breakout of resistance. The retest of the zone of interest 0.8526 and price consolidation below the level may provoke distribution
Scenario: there is no potential f

USD/CHF,4h chart pattern..USD/CHF buy trade setup based on my input:
---
✅ Trade Setup:
Buy Entry: 0.81300
First Target (TP1): 0.82300
Second Target (TP2): 0.83500
---
📊 Trade Metrics:
1. TP1 Distance:
0.82300 - 0.81300 = 0.01000 (100 pips)
2. TP2 Distance:
0.83500 - 0.81300 = 0.02200 (220 pips)
---
🛑 S

GBP/JPY - Triangle Breakout (12.06.2025)The GBP/JPY Pair on the M30 timeframe presents a Potential Selling Opportunity due to a recent Formation of a Triangle Breakout Pattern. This suggests a shift in momentum towards the downside in the coming hours.
Possible Short Trade:
Entry: Consider Entering A Short Position around Trendline

See all forex ideas
| GBP | JPY | CHF | CAD | |||||
|---|---|---|---|---|---|---|---|---|
| - | - | - | - | - | - | - | ||
| - | - | - | - | - | - | - | ||
| GBP | - | - | - | - | - | - | - | |
| JPY | - | - | - | - | - | - | - | |
| CHF | - | - | - | - | - | - | - | |
| AUD | - | - | - | - | - | - | - | |
| CNY | - | - | - | - | - | - | - | |
| CAD | - | - | - | - | - | - | - |
News didn't load
Looks like that didn't go very well. Let's try again.
Trade directly on the supercharts through our supported, fully-verified and user-reviewed brokers.


