NSDQ100 Bullish breakout retest?Donald Trump escalated trade tensions again, threatening a 35% tariff on Canadian goods shortly after reopening trade talks, and floated doubling global tariffs to 20%. This reinforces his aggressive protectionist stance and puts renewed pressure on allies like Canada and Vietnam, the latter blindsi

The best trades require research, then commitment.
Get started for free$0 forever, no credit card needed

Scott "Kidd" PoteetThe unlikely astronaut

Where the world does markets
Join 100 million traders and investors taking the future into their own hands.

Airbnb: Downtrend Set to Resume SoonSince our last update, Airbnb has experienced a rebound, which diverted the stock from the anticipated sell-off. However, the price is expected to soon resume its downward trajectory and, as the next key step, break through support at $108.60. This move should complete turquoise wave 3, with all sub

A bit of profit taking on NVDA and then up again?NASDAQ:NVDA is the most talked about and everyone is capitalizing on that. Let's take a look.
NASDAQ:NVDA
Let us know what you think in the comments below.
Thank you.
75.2% of retail investor accounts lose money when trading CFDs with this provider. You should consider whether you understand

GBP/AUD - Bearish Flag (10.07.2025)The GBP/AUD Pair on the M30 timeframe presents a Potential Selling Opportunity due to a recent Formation of a Bearish Flag Pattern. This suggests a shift in momentum towards the downside in the coming hours.
Possible Short Trade:
Entry: Consider Entering A Short Position around Trendline Of Th

Let’s talk about technical analysis & stops.Technical analysis is not your decision-making process — it’s a tool to help you structure better trading decisions by studying past price movements to anticipate likely future moves.
👉 Every time you look at a chart, you should decide:
✅ Do I want to trade at all?
✅ What’s my entry?
✅ Where’s my st

Eth $2,500 Resistance — Will Harmonic Pattern Trigger a Rally?Ethereum Stuck at $2,500 Resistance — Will Harmonic Pattern Trigger a Rally to $3,400?
Ethereum has been trading in a prolonged consolidation phase around the $2,500 level — a region that has acted as resistance for several weeks. This extended period of sideways action could signify either accumul

SOLANA Loves THIS Pattern | BULLISHSolana usually increases alongside ETH. Possible because its a big competitor.
We can see SOL follows ETH very closely, with the exception of dipping earlier than ETH by a week:
In the 4h, we see a push to breakout above the neckline resistance:
In the daily timeframe, SOL is just about to br

Is Bitcoin Working Out a New Leg Up? Onchain Data Says It May BeDiamond hands are waving goodbye and institutions are loading up — it’s why Bitcoin may be struggling to break out of its current consolidation range. How long can this accumulation phase continue?
And yes — we look at the trades of the decade — two transactions where each one moved a cool billie

BTC monthly yelling at us for something interesting ?We read daily news about ETF, accumulation by institutes and scarcity in the exchanges, but I recognize something different in the chart based on multiple indicators. Historically, BTC boomed after touching 50 EMA and whenever it is extended it traces back to 50 EMA on monthly chart. As per current

Gold on the Move – Major Resistance Levels to Watch AheadThe current price action looks strong, and if the bullish momentum continues, we have three main target levels in mind.
The first target is $3,380. This is an important level we expect gold to reach soon if the trend continues upward.
If the price breaks above $3,380, the next target is $3,433. Th

See all editors' picks ideas
Dynamic Gap Probability ToolDynamic Gap Probability Tool measures the percentage gap between price and a chosen moving average, then analyzes your chart history to estimate the likelihood of the next candle moving up or down. It dynamically adjusts its sample size to ensure statistical robustness while focusing on the exact de

EVaR Indicator and Position SizingThe Problem:
Financial markets consistently show "fat-tailed" distributions where extreme events occur with higher frequency than predicted by normal distributions (Gaussian or even log-normal). These fat tails manifest in sudden price crashes, volatility spikes, and black swan events that traditi

Divergence Screener [Trendoscope®]🎲Overview
The Divergence Screener is a powerful TradingView indicator designed to detect and visualize bullish and bearish divergences, including hidden divergences, between price action and a user-selected oscillator. Built with flexibility in mind, it allows traders to customize the oscillator

Logarithmic Moving Average (LMA) [QuantAlgo]🟢 Overview
The Logarithmic Moving Average (LMA) uses advanced logarithmic weighting to create a dynamic trend-following indicator that prioritizes recent price action while maintaining statistical significance. Unlike traditional moving averages that use linear or exponential weights, this indic

Volumatic Support/Resistance Levels [BigBeluga]🔵 OVERVIEW
A smart volume-powered tool for identifying key support and resistance zones—enhanced with real-time volume histogram fills and high-volume markers.
Volumatic Support/Resistance Levels detects structural levels from swing highs and lows, and wraps them in dynamic histograms that re

True Close – Institutional Trading Sessions (Zeiierman)█ Overview
True Close – Institutional Trading Sessions (Zeiierman) is a professional-grade session mapping tool designed to help traders align with how institutions perceive the market’s true close. Unlike the textbook “daily close” used by retail traders, institutional desks often anchor their

Open Interest Footprint IQ [TradingIQ]Hello Traders!
Th e Open Interest Footprint IQ indicator is an advanced visualization tool designed for cryptocurrency markets. It provides a granular, real-time breakdown of open interest changes across different price levels, allowing traders to see how aggressive market participation is distribu

Zigzag CandlesCan't deny that I am obsessed with zigzags. Been doing some crazy experiments with it and have many more in pipeline. I believe zigzag can be used to derive better trend following methods. Here is an attempt to visualize zigzag as candlesticks. Next steps probably to derive moving average, atr (alth

MathStatisticsKernelFunctionsLibrary "MathStatisticsKernelFunctions"
TODO: add library description here
uniform(distance, bandwidth) Uniform kernel.
Parameters:
distance : float, distance to kernel origin.
bandwidth : float, default=1.0, bandwidth limiter to weight the kernel.
Returns: float.
triangular(distance

MathConstantsLibrary "MathConstants"
Mathematical Constants
E() The number e
Log2E() The number log (e)
Log10E() The number log (e)
Ln2() The number log (2)
Ln10() The number log (10)
LnPi() The number log (pi)
Ln2PiOver2() The number log (2*pi)/2
InvE() The number 1/e
SqrtE() The n

See all indicators and strategies
News didn't load
Looks like that didn't go very well. Let's try again.
Community trends
Tesla (TSLA) 1-hour chartTesla (TSLA) 1-hour chart im provided, here are the key bullish target points indicated by the chart analysis:
📈 Bullish Target Points (Upside Levels):
First Target Point:
🔹 Around $338.00 – $340.00
This level is marked as the initial breakout target, likely based on recent price structure and res

What's the deal with BRK.B?! Where is the short term bottom?I'm pretty new to this, so I'm looking to see if anyone has any thoughts about BRK.B. The best looking support is the April low, but it seems like it could fall below to the Jan 2025 low with the way it is steadily dropping. That would suck! I'm averaged at $491 and prefer not to see it go that low,

NETFLIX 1D MA50 test is a new buy opportunity.Netflix (NFLX) has been rising non-stop since the April 07 bottom on the 1D MA200 (orange trend-line). This bottom has been the latest Higher Low of the 3-year Channel Up that started on the June 14 2022 bottom.
This kickstarted its third long-term Bullish Leg. The previous two have been fairly sim

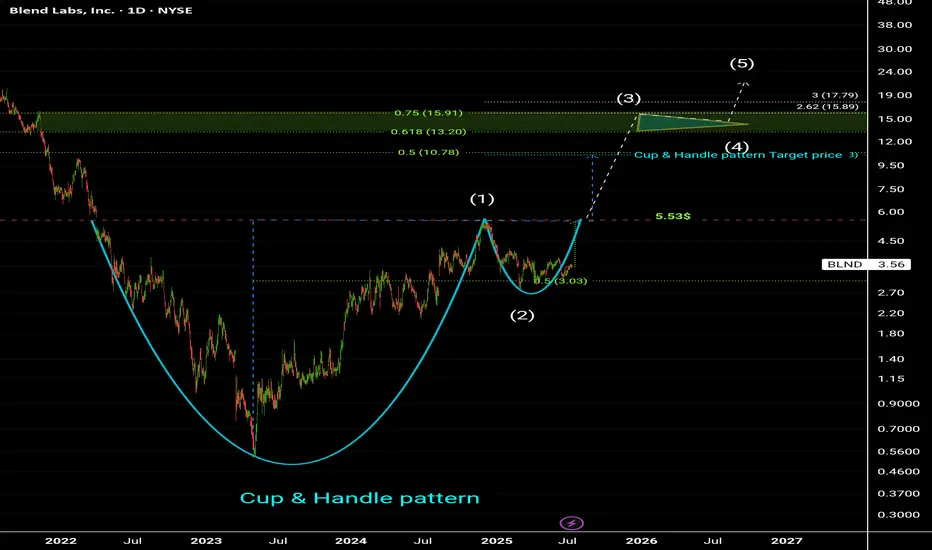
$NVDA - $270 PT in BULL ChannelThe stock is currently bouncing off of the lower channel line of the rising Bull Channel. Price action has created a Cup and Handle. The projected Price Objective sits at around $270. Remember, the height of the cup is the project target which from current stock price extends to around $270.

NFLX CRACK!!Classic breakdown move from a rising F flag!
Massive Head and shoulders formed, that head test followed through, taking out stops, and now failing off the top of the channel.
Screaming CAUTION to the bulls!
Nice simple short setup for bears.
Click boost, follow, and subscribe. Let's get to 5,000

GOOG Wave B
Bullish price action from the last couple of months has been unconvincing, and this looks more like a wave B correction.
A break of the black ascending channel would be a trigger for wave C.
It would be interesting to see a reversal pattern in smaller timeframes if price touches the gray supply

Alphabet - The textbook break and retest!📧Alphabet ( NASDAQ:GOOGL ) will head much higher:
🔎Analysis summary:
If we look at the chart of Alphabet we can basically only see green lines. And despite the recent correction of about -30%, Alphabet remains in a very bullish market. Looking at the recent all time high break and retest, the

Blend labs inc (BLND).Cup and Handle pattern at the bottom
Target prices on chart.
Highly recommended for Buying now 👌
NYSE:DT (Dynatrace) local stop on its way to 60$+Since April 2025, Dynatrace has established a local uptrend. Based on the daily chart, the recent drop below $53 appears to have fulfilled one of the likely targets for wave iv. This may represent wave iv of a five-wave impulse originating from the April low. If correct, wave v is expected to push a

WC: 23.59 Target: 1800-2400 MOASS: 47k-100K: PROFITI am a trader...I have one goal at the end of the day: MAKE A PROFIT
This will be my final post on Gamestop as I am now dedicating ALL of my time to Macro Market Coverage...
I FIRMLY believe that there is a high potential for markets to turn SIGNIFICANTLY LOWER over the next year and plan to show

See all stocks ideas
Jul 14
FASTFastenal Company
Actual
—
Estimate
0.28
USD
Jul 14
WAFDWaFd, Inc.
Actual
—
Estimate
0.68
USD
Jul 14
LOOPLoop Industries, Inc.
Actual
—
Estimate
−0.06
USD
Jul 14
FNGRFingerMotion, Inc.
Actual
—
Estimate
—
Jul 14
BNEDBarnes & Noble Education, Inc
Actual
—
Estimate
−0.81
USD
Jul 14
UNTYUnity Bancorp, Inc.
Actual
—
Estimate
1.18
USD
Jul 14
CCELCryo-Cell International, Inc.
Actual
—
Estimate
−0.04
USD
Jul 14
EQBKEquity Bancshares, Inc.
Actual
—
Estimate
0.89
USD
See more events
News didn't load
Looks like that didn't go very well. Let's try again.
Community trends
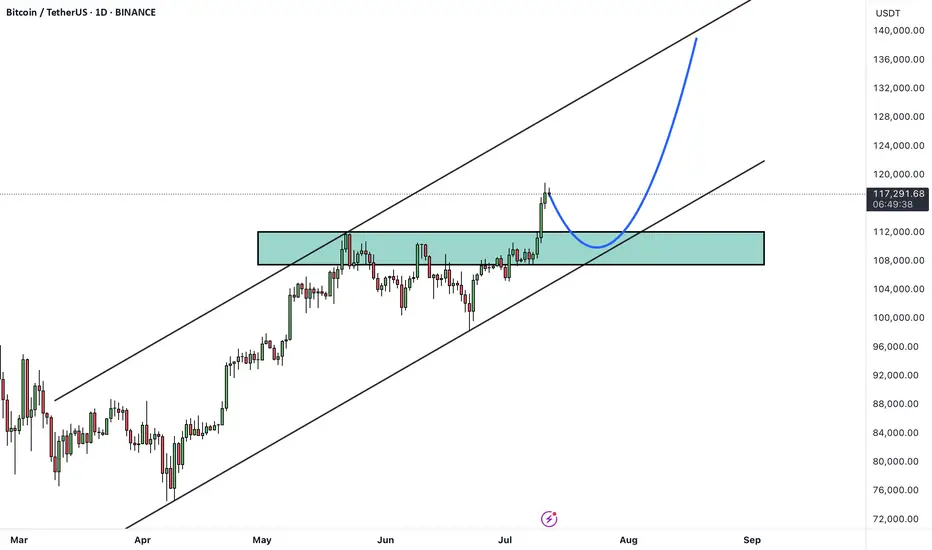
Bitcoin - Blue Skies, Retest Before $125k?Bitcoin has pushed into blue skies after breaking through a major resistance zone around 110,000 USD. The breakout was sharp and impulsive, pushing price well into uncharted territory above 117,000. At these levels, traditional resistance becomes harder to pinpoint, and the market often behaves irra

BITCOIN → Stopping after the rally? What next? 125K or 110K?BINANCE:BTCUSDT rose and updated its historical maximum to a new record of 118K with “kopecks” (different prices on different exchanges). Now the price has supposedly stopped and entered a consolidation phase, but it is too early to draw any conclusions based on this alone...
Fundamentally, Bi

Bitcoin Roadmap=>End of RallyBitcoin ( BINANCE:BTCUSDT ) has gained nearly +10% in the recent weekly candle so far. The question is where this rally could end up. So to get to that zone, let’s go to the weekly timeframe .
Before we start this analysis, let’s take a look at my last analysis on the weekly timeframe , whi

Bitcoin Crash? No! The Bullish Wave Starts Now! $155,601 Next!Some people are still expecting for "Bitcoin to go down." Poor bastards, the advance is just starting. Bitcoin just broke out of a 210 days long consolidation phase. After this huge, long-term consolidation, expect a major advance. Next target is now set at $155,601.
This week is the first week gre

ATH Mode On => Request Your Altcoin Analysis NowThe bulls are back in action, and momentum is building fast! ⚡
To celebrate this major milestone, I’m opening the floor to YOU 👇
Request any altcoin in the comments, and I’ll personally share my technical analysis on it! 📊✅
Let’s make the most of this market together — it’s altcoin season waiti

XLM BUY SETUP ,Bought From $0.37800XLM BUY SETUP
Currently $0.37800
Bought From $0.37800
(Trading plan If XLM go down to $0.36
will add more longs)
Expecting target $0.40 OR ABOVE
In the event of an early exit,
this analysis will be updated.
Its not a Financial advice

Bitcoin - The cycle is just starting!⚔️Bitcoin ( CRYPTO:BTCUSD ) just created new highs:
🔎Analysis summary:
Bitcoin is currently - especially with the new all time high breakout - just perfectly following previous cycle behavior. Since there is no real resistance above current price, apart from psychological levels, I do expect

CRYPTO - Big Guns Deployed (BTC $174K!)13 minutes of video; looking at Bitcoin, TOTAL, altcoins.
HOT breaking out now! - Trade setup in video.
See you @ BTC $174K!
Not advice

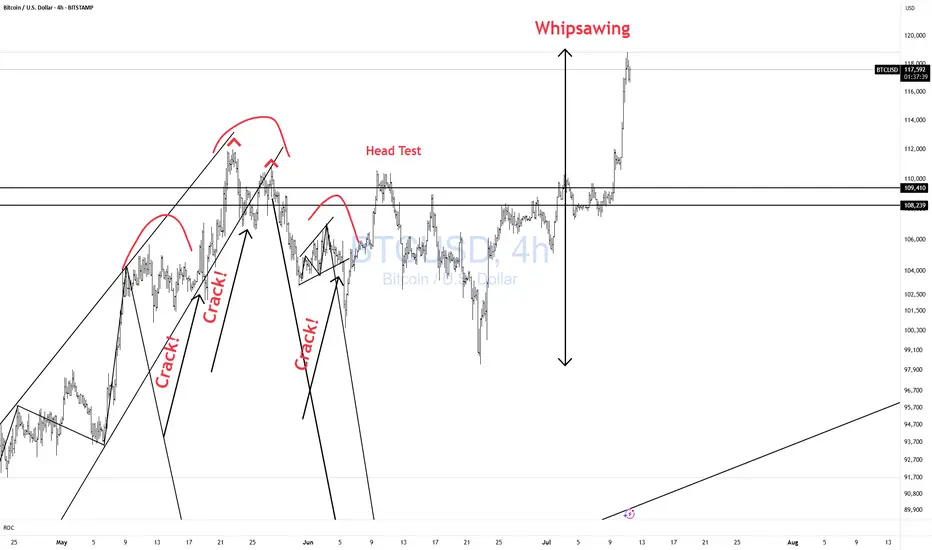
BTCUSD Whipsawing! CAUTION!Bulls CAUTION! Price is whipsawing all over the place.
Better to be out of the market wishing you were in than in wishing you were out!! Don't chase!!
BTCUSDTHello Traders! 👋
What are your thoughts on BITCOIN?
Bitcoin has recently broken above its all-time high and printed a new record high, signaling strong bullish momentum. Currently, the market has entered a consolidation phase, which is typical after such a major breakout.
A pullback toward the pr
See all crypto ideas
News didn't load
Looks like that didn't go very well. Let's try again.
GOLD ROUTE MAP UPDATEHey Everyone,
Great finish to the week!!!
After completing our Bearish targets throughout the week, we got the swing perfectly, like we analysed and was waiting for our Bullish target to be complete.
- We got the Bullish target at 3358 HIT perfectly completing this range!!
BULLISH TARGET
3358

GOLD → Distribution. There is potential for growth to 3450–3500FX:XAUUSD breaks through consolidation resistance and forms a distribution pattern. A breakout of 3345-3358 could lead to another rally amid high economic risks...
Gold is rising for the third day in a row amid growing concerns about new tariffs announced by Trump. He threatened to impose tari

Lingrid | GOLD Potential A-B-C Movement in ProgressOANDA:XAUUSD bounced strongly from the ascending trendline and reclaimed key structure near 3,275, signaling strength after rejecting the prior downward channel. Price has broken above the descending trendline and is now testing the 3,329 resistance zone with bullish momentum. If buyers maintain co

Gold Eyes 3,386 with No Reversal in SignsGold Eyes 3,386 with No Reversal in Signs
Gold continues its upward trajectory, with potential extension toward the $3,386 level.
In my view, the primary catalyst behind this rally is market manipulation.
Additionally, recent comments from former President Trump regarding tariffs, and remarks f

ALUMINIUM: Selling opportunity following trendline breakALUMINIUM climbed a steep uptrend but it might meets its end with this recent break through this rising trendline. When price respects a trendline repeatedly, it becomes significant, its break indicating either a potential reversal or major pause in the trend. The candlestick that broke the trendlin

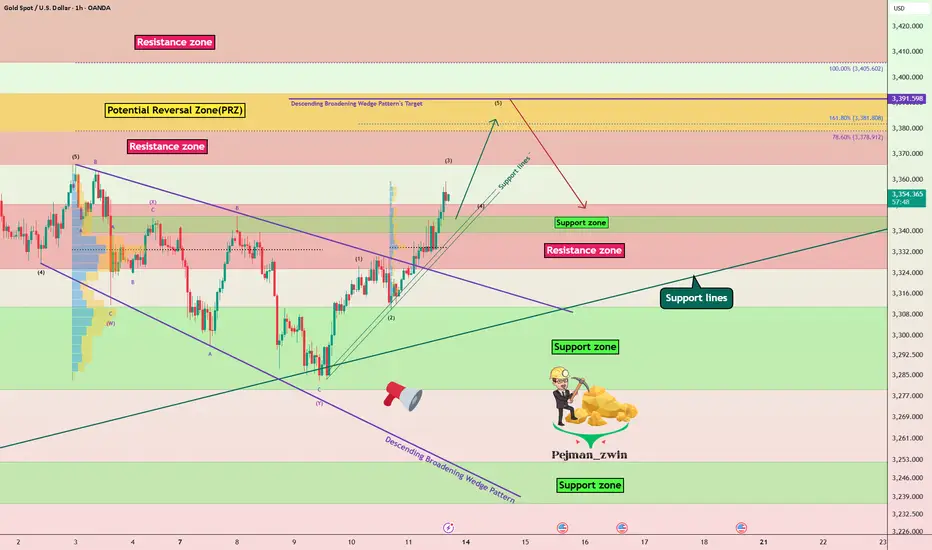
Gold Roadmap=>Short termGold ( OANDA:XAUUSD ) currently appears to have broken through the Resistance zone($3,350-$3,325) .
The Resistance zone($3,350-$3,325) was broken with the help of the Descending Broadening Wedge Pattern , the upper line of this classic pattern having served as an important resistance lin

XAU/USD : Gold at a Turning Point – Rejection or Breakout Ahead?By analyzing the TVC:GOLD (XAUUSD) chart on the 4-hour timeframe, we can see that price climbed to $3330 today, entering a key supply zone, which triggered a pullback down to $3310. Gold is now trading around $3317, and I’m watching several potential setups closely.
Scenario 1:
If gold stabilizes

THE KOG REPORT - UpdateEnd of day update from us here at KOG:
I can't say that was a bad day or week. We got the move from 3310 into our Excalibur target level 3332 and then started looking for a potential reversal. Gold, again, had other plans and just continued to activate Excalibur after Excalibur higher combined wi

DeGRAM | GOLD held the trend line📊 Technical Analysis
● Bulls defended the channel‐base 3 280 zone, breaking the six-week falling wedge and reclaiming 3 312; structure flips to higher-highs within the rising channel.
● A close above the wedge lip at 3 355 should unlock the grey range ceiling where the May trend-cap and 3 430 – 3

See all futures ideas
News didn't load
Looks like that didn't go very well. Let's try again.
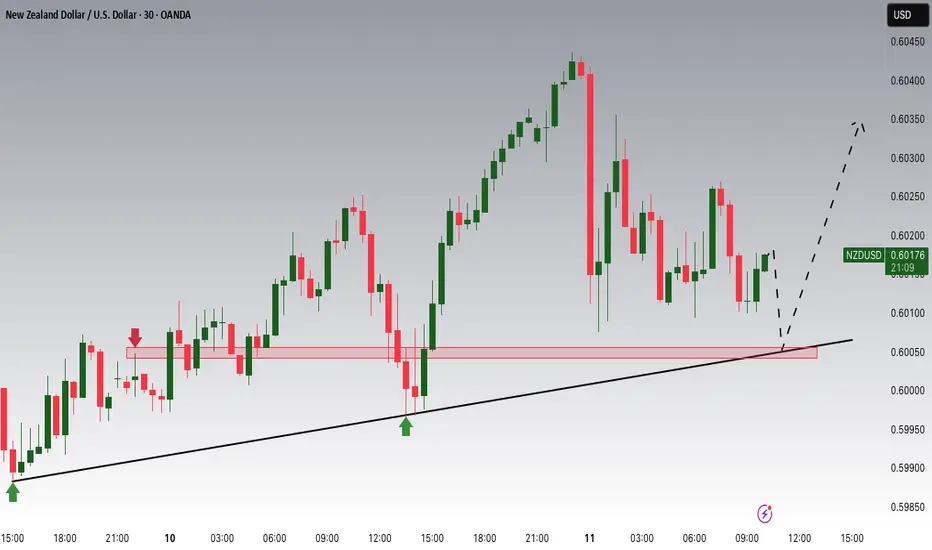
NZDUSD Potential UpsidesHey Traders, in today's trading session we are monitoring NZDUSD for a buying opportunity around 0.60000 zone, NZDUSD is trading in an uptrend and currently is in a correction phase in which it is approaching the trend at 0.60000 support and resistance area.
Trade safe, Joe.
EURAUD: Rebound to 1.798 is high probabilityI am watching for a reversal here EURAUD as marked on my chart, expecting a rejection with a upside target at around 1.798.
This are is where it can become a decision point, either price finds support and bounces, or it breaks below, and that’s when we might see the move start to extend lower.
If

NZDUSD beating for a robust up move soon The coming weekdmight be a more volatile week for NZD, Stay put, I feel take out for long positions when you see the Opportunities.

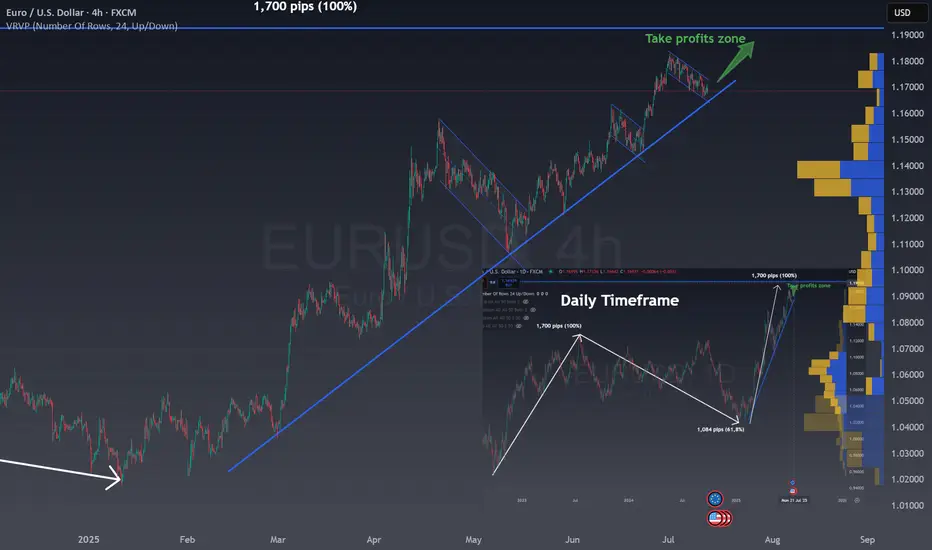
One last rally in EUR/USDIn the right bottom you can see the Daily chart for EUR/USD:
The chart shows the EUR/USD on a daily timeframe.
There was an initial strong rise of 1,700 pips, marked as a 100% move.
After this, the price corrected downward by 1,084 pips, which is 61.8% of the previous rise.
The 61.8% re
USD/JPY - H1- Wedge Breakout (07.07.2025)The USD/JPY pair on the H1 timeframe presents a Potential Buying Opportunity due to a recent Formation of a Wedge Breakout Pattern. This suggests a shift in momentum towards the upside and a higher likelihood of further advances in the coming hours.
Possible Long Trade:
Entry: Consider Entering A

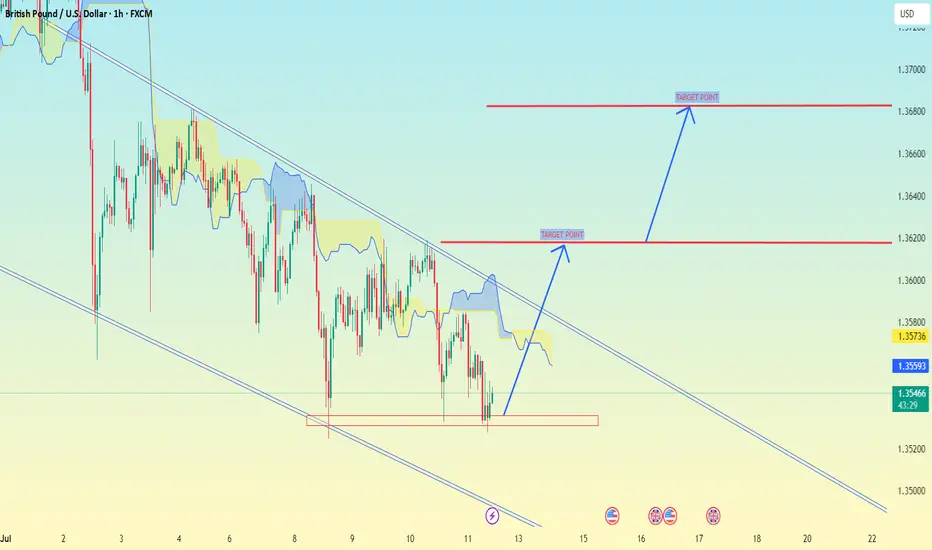
GBP/USD chart (1H timeframe)GBP/USD chart (1H timeframe), potential breakout from a descending channel, supported by the Ichimoku Cloud and marked target levels.
📈 Current Analysis Highlights:
Price is near the lower end of the descending channel.
A bullish reversal setup is forming.
I'm drawn two Target Points indicating
EURAUD Breakdown Incoming? Price + COT + Seasonality🧠 MACRO & INSTITUTIONAL FLOWS (COT)
EURO (EUR)
Strong increase in net long positions by non-commercials: +16,146
Commercials also added long exposure: +25,799
Bias: moderately bullish
AUSTRALIAN DOLLAR (AUD)
Non-commercials remain heavily net short (long/short ratio: 15% vs 63.6%)
Slight increase

USDCAD I Weekly CLS I Model 1 I KL - OB I Target CLS LowYo Market Warriors ⚔️
BIG SHORT — if you’ve been riding with me, you already know:
🎯My system is 100% mechanical. No emotions. No trend lines. No subjective guessing. Just precision, structure, and sniper entries.
🧠 What’s CLS?
It’s the real smart money. The invisible hand behind $7T/day — bank

Gbpusd Long SetupGbpusd (M,W,D Strong Bullish)
Daily Bullish trend channel
1:4hr Demand Zone +Fvg
2:1hr Demand Zone +Fvg
According to Seasonality :gbpusd Bullish (July)
USDCAD MARKET OUTLOOK📊 USDCAD Institutional Market Outlook
🔷 Monthly & Weekly Structure – Bearish Bias
A Monthly Fair Value Gap (FVG) was formed after a breakaway gap, closing all prior bullish FVGs. This signals strong bearish intent from institutions, with a likely draw toward the next key liquidity level at 1.34210.

See all forex ideas
| EUR | USD | GBP | JPY | AUD | CAD | |||
|---|---|---|---|---|---|---|---|---|
| EUR | - | - | - | - | - | - | - | |
| USD | - | - | - | - | - | - | - | |
| GBP | - | - | - | - | - | - | - | |
| JPY | - | - | - | - | - | - | - | |
| CHF | - | - | - | - | - | - | - | |
| AUD | - | - | - | - | - | - | - | |
| CNY | - | - | - | - | - | - | - | |
| CAD | - | - | - | - | - | - | - |
News didn't load
Looks like that didn't go very well. Let's try again.
Trade directly on the supercharts through our supported, fully-verified and user-reviewed brokers.


